Immigrants from China vs South African No Schooling Completed
COMPARE
Immigrants from China
South African
No Schooling Completed
No Schooling Completed Comparison
Immigrants from China
South Africans
2.6%
NO SCHOOLING COMPLETED
0.1/ 100
METRIC RATING
275th/ 347
METRIC RANK
1.8%
NO SCHOOLING COMPLETED
99.1/ 100
METRIC RATING
89th/ 347
METRIC RANK
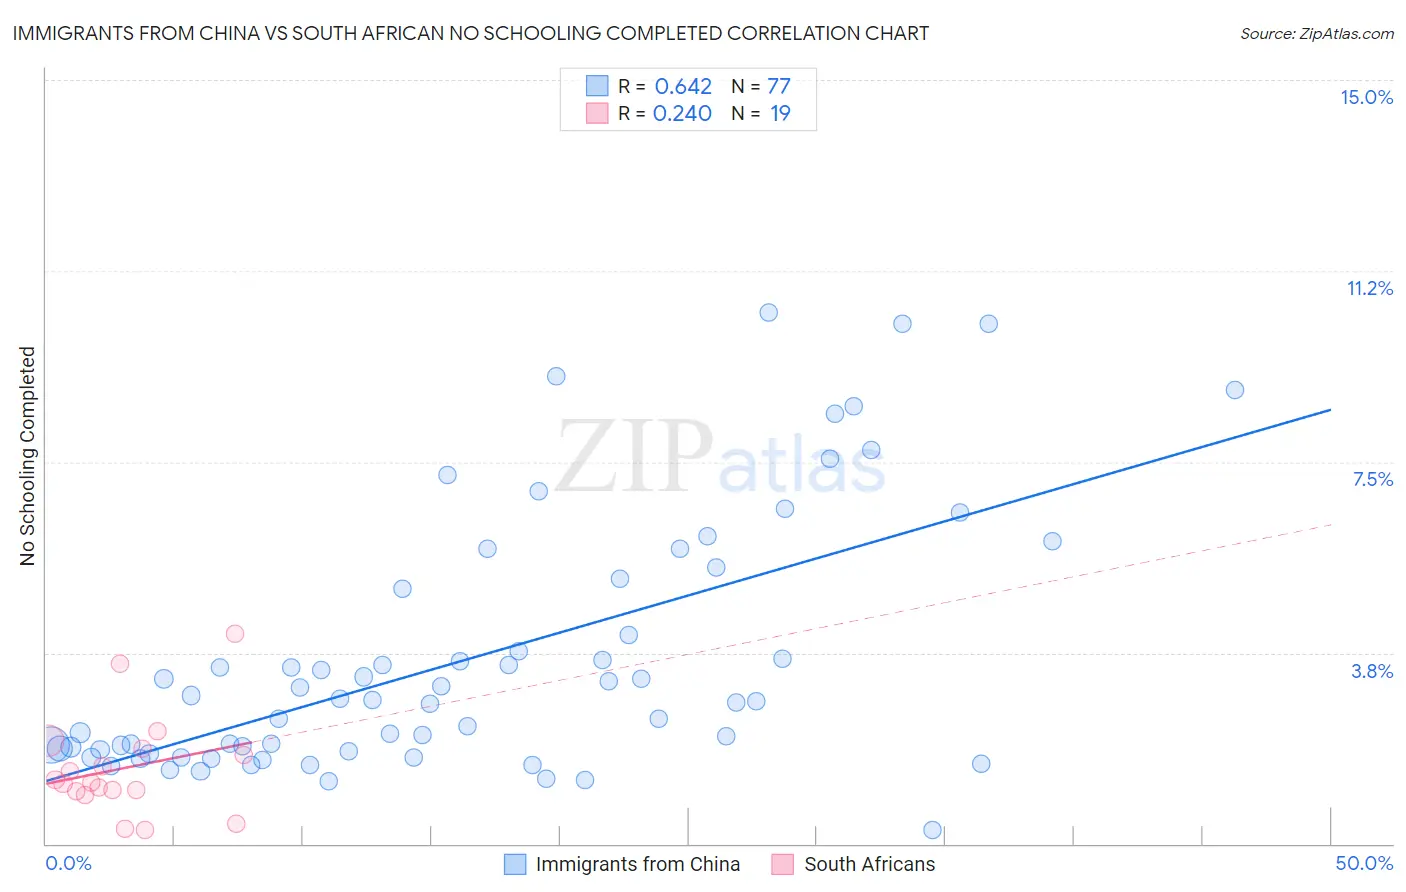
Immigrants from China vs South African No Schooling Completed Correlation Chart
The statistical analysis conducted on geographies consisting of 450,744,905 people shows a significant positive correlation between the proportion of Immigrants from China and percentage of population with no schooling in the United States with a correlation coefficient (R) of 0.642 and weighted average of 2.6%. Similarly, the statistical analysis conducted on geographies consisting of 181,622,375 people shows a weak positive correlation between the proportion of South Africans and percentage of population with no schooling in the United States with a correlation coefficient (R) of 0.240 and weighted average of 1.8%, a difference of 45.8%.
No Schooling Completed Correlation Summary
| Measurement | Immigrants from China | South African |
| Minimum | 0.26% | 0.27% |
| Maximum | 10.4% | 4.1% |
| Range | 10.2% | 3.9% |
| Mean | 3.6% | 1.5% |
| Median | 2.8% | 1.2% |
| Interquartile 25% (IQ1) | 1.8% | 1.0% |
| Interquartile 75% (IQ3) | 5.1% | 1.9% |
| Interquartile Range (IQR) | 3.3% | 0.84% |
| Standard Deviation (Sample) | 2.5% | 0.99% |
| Standard Deviation (Population) | 2.5% | 0.96% |
Similar Demographics by No Schooling Completed
Demographics Similar to Immigrants from China by No Schooling Completed
In terms of no schooling completed, the demographic groups most similar to Immigrants from China are Ghanaian (2.6%, a difference of 0.18%), Immigrants from Cameroon (2.5%, a difference of 0.56%), Immigrants from Western Africa (2.6%, a difference of 0.56%), Immigrants from Philippines (2.6%, a difference of 0.61%), and Immigrants from Uzbekistan (2.6%, a difference of 0.81%).
| Demographics | Rating | Rank | No Schooling Completed |
| Taiwanese | 0.3 /100 | #268 | Tragic 2.5% |
| Immigrants | Nigeria | 0.2 /100 | #269 | Tragic 2.5% |
| Immigrants | Peru | 0.2 /100 | #270 | Tragic 2.5% |
| Cubans | 0.2 /100 | #271 | Tragic 2.5% |
| Immigrants | Bolivia | 0.2 /100 | #272 | Tragic 2.5% |
| Immigrants | Cameroon | 0.1 /100 | #273 | Tragic 2.5% |
| Ghanaians | 0.1 /100 | #274 | Tragic 2.6% |
| Immigrants | China | 0.1 /100 | #275 | Tragic 2.6% |
| Immigrants | Western Africa | 0.1 /100 | #276 | Tragic 2.6% |
| Immigrants | Philippines | 0.1 /100 | #277 | Tragic 2.6% |
| Immigrants | Uzbekistan | 0.1 /100 | #278 | Tragic 2.6% |
| Barbadians | 0.1 /100 | #279 | Tragic 2.6% |
| Trinidadians and Tobagonians | 0.1 /100 | #280 | Tragic 2.6% |
| Afghans | 0.1 /100 | #281 | Tragic 2.6% |
| Immigrants | Ghana | 0.1 /100 | #282 | Tragic 2.6% |
Demographics Similar to South Africans by No Schooling Completed
In terms of no schooling completed, the demographic groups most similar to South Africans are Immigrants from Western Europe (1.8%, a difference of 0.040%), Osage (1.8%, a difference of 0.080%), Ukrainian (1.8%, a difference of 0.40%), Immigrants from Australia (1.7%, a difference of 0.44%), and Immigrants from Denmark (1.7%, a difference of 0.48%).
| Demographics | Rating | Rank | No Schooling Completed |
| Immigrants | South Africa | 99.3 /100 | #82 | Exceptional 1.7% |
| Potawatomi | 99.3 /100 | #83 | Exceptional 1.7% |
| Immigrants | Denmark | 99.2 /100 | #84 | Exceptional 1.7% |
| Immigrants | Australia | 99.2 /100 | #85 | Exceptional 1.7% |
| Ukrainians | 99.2 /100 | #86 | Exceptional 1.8% |
| Osage | 99.2 /100 | #87 | Exceptional 1.8% |
| Immigrants | Western Europe | 99.2 /100 | #88 | Exceptional 1.8% |
| South Africans | 99.1 /100 | #89 | Exceptional 1.8% |
| Sioux | 99.0 /100 | #90 | Exceptional 1.8% |
| Immigrants | Germany | 99.0 /100 | #91 | Exceptional 1.8% |
| Romanians | 98.8 /100 | #92 | Exceptional 1.8% |
| Turks | 98.7 /100 | #93 | Exceptional 1.8% |
| Immigrants | Nonimmigrants | 98.5 /100 | #94 | Exceptional 1.8% |
| Puget Sound Salish | 98.5 /100 | #95 | Exceptional 1.8% |
| Bhutanese | 98.4 /100 | #96 | Exceptional 1.8% |