Immigrants from Laos vs Honduran 5th Grade
COMPARE
Immigrants from Laos
Honduran
5th Grade
5th Grade Comparison
Immigrants from Laos
Hondurans
96.0%
5TH GRADE
0.0/ 100
METRIC RATING
305th/ 347
METRIC RANK
95.6%
5TH GRADE
0.0/ 100
METRIC RATING
324th/ 347
METRIC RANK
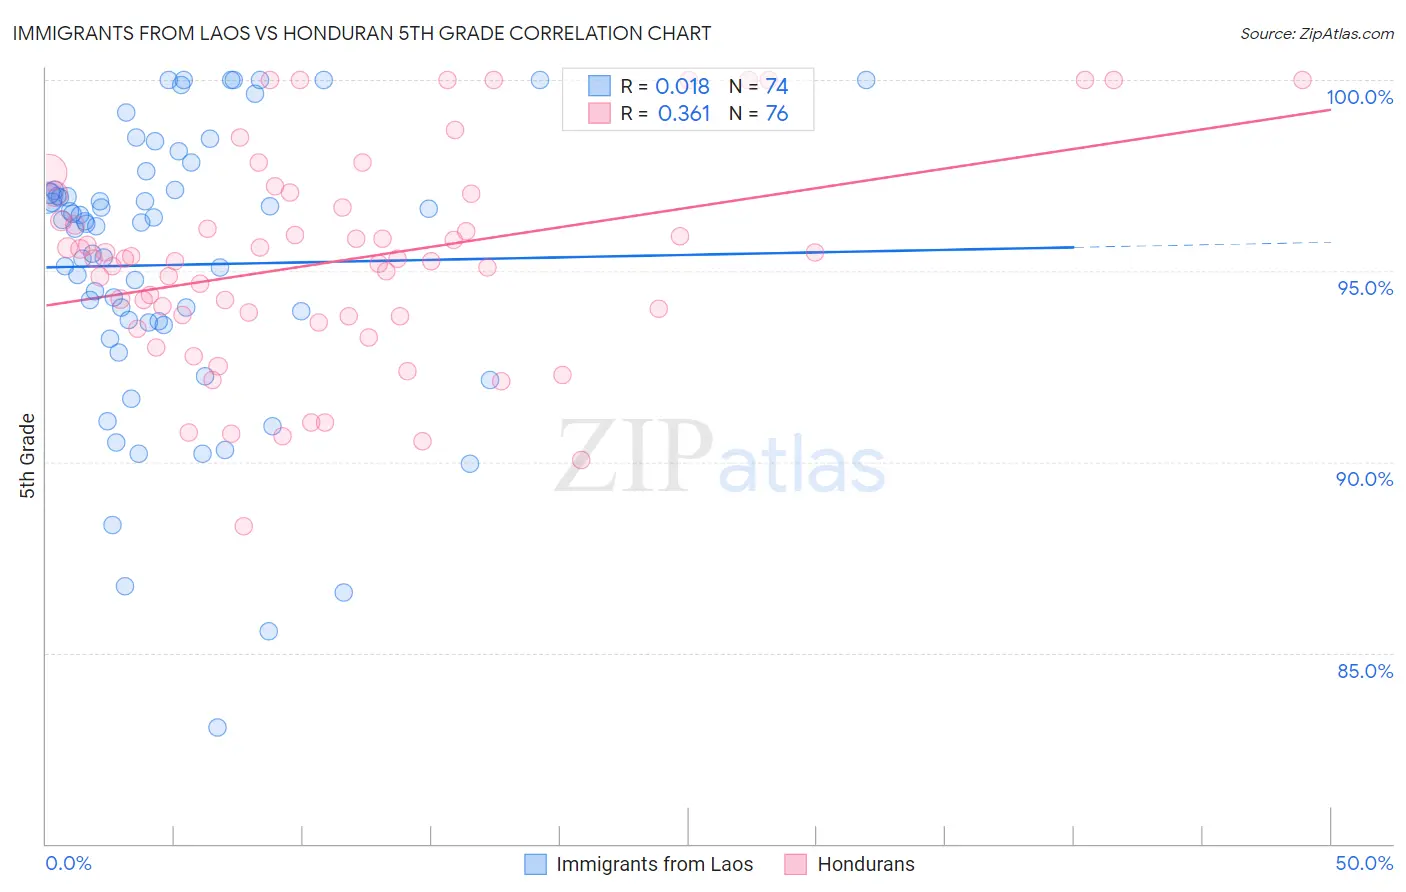
Immigrants from Laos vs Honduran 5th Grade Correlation Chart
The statistical analysis conducted on geographies consisting of 201,472,886 people shows no correlation between the proportion of Immigrants from Laos and percentage of population with at least 5th grade education in the United States with a correlation coefficient (R) of 0.018 and weighted average of 96.0%. Similarly, the statistical analysis conducted on geographies consisting of 357,784,803 people shows a mild positive correlation between the proportion of Hondurans and percentage of population with at least 5th grade education in the United States with a correlation coefficient (R) of 0.361 and weighted average of 95.6%, a difference of 0.50%.
5th Grade Correlation Summary
| Measurement | Immigrants from Laos | Honduran |
| Minimum | 83.0% | 88.3% |
| Maximum | 100.0% | 100.0% |
| Range | 17.0% | 11.7% |
| Mean | 95.2% | 95.3% |
| Median | 96.3% | 95.3% |
| Interquartile 25% (IQ1) | 93.7% | 93.8% |
| Interquartile 75% (IQ3) | 97.1% | 96.8% |
| Interquartile Range (IQR) | 3.4% | 3.0% |
| Standard Deviation (Sample) | 3.7% | 2.7% |
| Standard Deviation (Population) | 3.7% | 2.7% |
Demographics Similar to Immigrants from Laos and Hondurans by 5th Grade
In terms of 5th grade, the demographic groups most similar to Immigrants from Laos are Immigrants from Burma/Myanmar (96.1%, a difference of 0.010%), Immigrants from Haiti (96.0%, a difference of 0.010%), Immigrants from Caribbean (96.0%, a difference of 0.020%), Ecuadorian (96.0%, a difference of 0.030%), and Immigrants from Guyana (96.0%, a difference of 0.030%). Similarly, the demographic groups most similar to Hondurans are Immigrants from Fiji (95.6%, a difference of 0.020%), Immigrants from Nicaragua (95.6%, a difference of 0.070%), Immigrants from Belize (95.7%, a difference of 0.090%), Japanese (95.7%, a difference of 0.16%), and Central American Indian (95.7%, a difference of 0.16%).
| Demographics | Rating | Rank | 5th Grade |
| Immigrants | Burma/Myanmar | 0.0 /100 | #304 | Tragic 96.1% |
| Immigrants | Laos | 0.0 /100 | #305 | Tragic 96.0% |
| Immigrants | Haiti | 0.0 /100 | #306 | Tragic 96.0% |
| Immigrants | Caribbean | 0.0 /100 | #307 | Tragic 96.0% |
| Ecuadorians | 0.0 /100 | #308 | Tragic 96.0% |
| Immigrants | Guyana | 0.0 /100 | #309 | Tragic 96.0% |
| Indonesians | 0.0 /100 | #310 | Tragic 96.0% |
| Immigrants | Bangladesh | 0.0 /100 | #311 | Tragic 96.0% |
| Vietnamese | 0.0 /100 | #312 | Tragic 95.9% |
| Bangladeshis | 0.0 /100 | #313 | Tragic 95.9% |
| Immigrants | Portugal | 0.0 /100 | #314 | Tragic 95.9% |
| Nicaraguans | 0.0 /100 | #315 | Tragic 95.9% |
| Immigrants | Ecuador | 0.0 /100 | #316 | Tragic 95.8% |
| Belizeans | 0.0 /100 | #317 | Tragic 95.8% |
| Immigrants | Vietnam | 0.0 /100 | #318 | Tragic 95.8% |
| Japanese | 0.0 /100 | #319 | Tragic 95.7% |
| Central American Indians | 0.0 /100 | #320 | Tragic 95.7% |
| Immigrants | Belize | 0.0 /100 | #321 | Tragic 95.7% |
| Immigrants | Nicaragua | 0.0 /100 | #322 | Tragic 95.6% |
| Immigrants | Fiji | 0.0 /100 | #323 | Tragic 95.6% |
| Hondurans | 0.0 /100 | #324 | Tragic 95.6% |