Immigrants from Chile vs Belgian 5th Grade
COMPARE
Immigrants from Chile
Belgian
5th Grade
5th Grade Comparison
Immigrants from Chile
Belgians
97.2%
5TH GRADE
16.6/ 100
METRIC RATING
201st/ 347
METRIC RANK
98.1%
5TH GRADE
99.9/ 100
METRIC RATING
38th/ 347
METRIC RANK
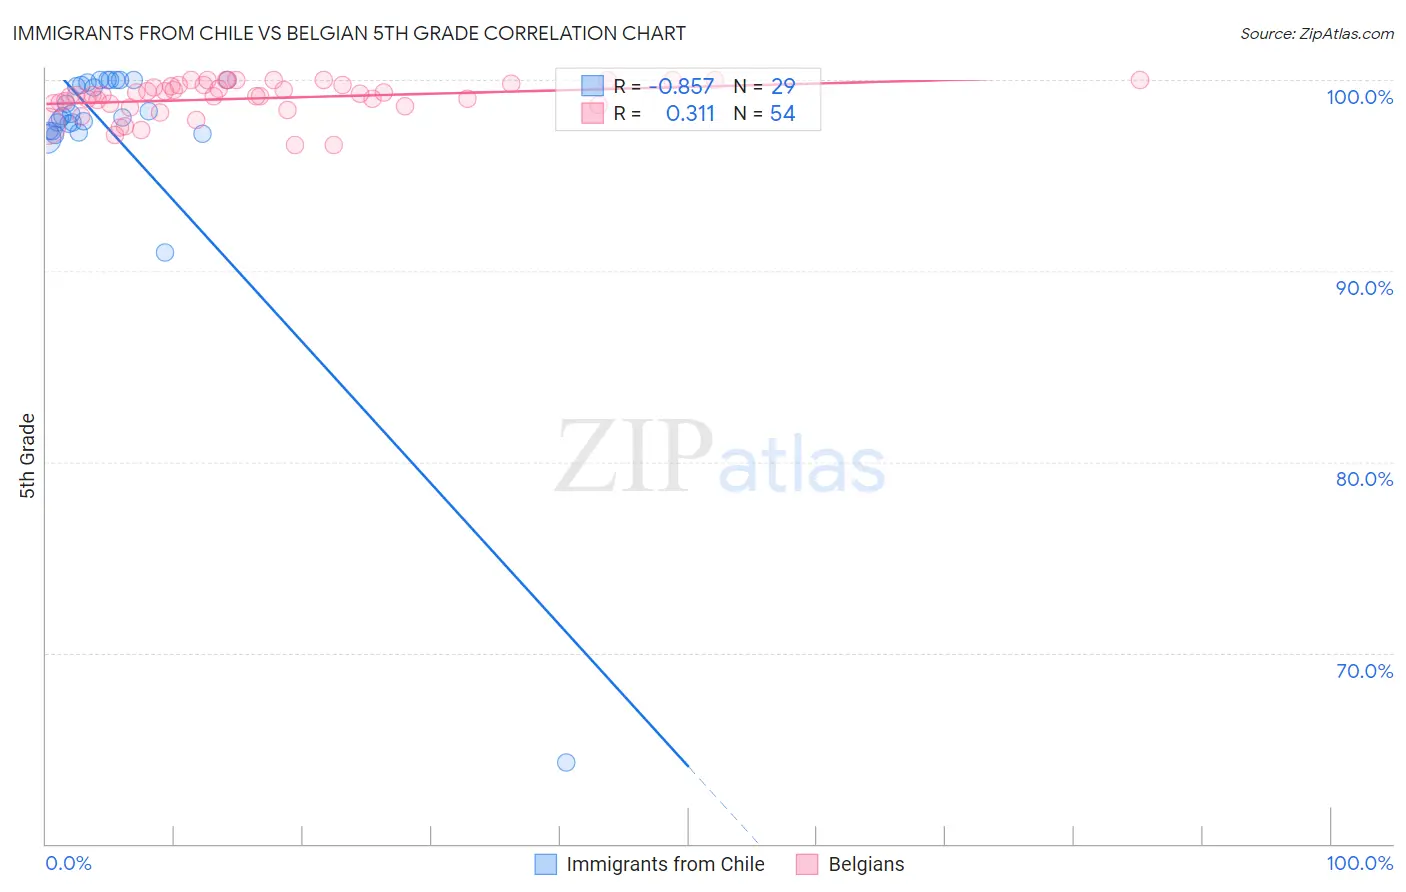
Immigrants from Chile vs Belgian 5th Grade Correlation Chart
The statistical analysis conducted on geographies consisting of 218,647,266 people shows a very strong negative correlation between the proportion of Immigrants from Chile and percentage of population with at least 5th grade education in the United States with a correlation coefficient (R) of -0.857 and weighted average of 97.2%. Similarly, the statistical analysis conducted on geographies consisting of 356,016,627 people shows a mild positive correlation between the proportion of Belgians and percentage of population with at least 5th grade education in the United States with a correlation coefficient (R) of 0.311 and weighted average of 98.1%, a difference of 0.94%.
5th Grade Correlation Summary
| Measurement | Immigrants from Chile | Belgian |
| Minimum | 64.3% | 96.6% |
| Maximum | 100.0% | 100.0% |
| Range | 35.7% | 3.4% |
| Mean | 97.2% | 99.0% |
| Median | 98.1% | 99.2% |
| Interquartile 25% (IQ1) | 97.3% | 98.7% |
| Interquartile 75% (IQ3) | 99.9% | 99.7% |
| Interquartile Range (IQR) | 2.6% | 1.0% |
| Standard Deviation (Sample) | 6.6% | 0.90% |
| Standard Deviation (Population) | 6.5% | 0.89% |
Similar Demographics by 5th Grade
Demographics Similar to Immigrants from Chile by 5th Grade
In terms of 5th grade, the demographic groups most similar to Immigrants from Chile are Immigrants from Northern Africa (97.2%, a difference of 0.0%), Native/Alaskan (97.2%, a difference of 0.010%), African (97.2%, a difference of 0.010%), Immigrants from Bahamas (97.2%, a difference of 0.010%), and Immigrants from Zaire (97.1%, a difference of 0.020%).
| Demographics | Rating | Rank | 5th Grade |
| Immigrants | Albania | 28.5 /100 | #194 | Fair 97.2% |
| Guamanians/Chamorros | 26.8 /100 | #195 | Fair 97.2% |
| Hawaiians | 25.6 /100 | #196 | Fair 97.2% |
| Brazilians | 25.4 /100 | #197 | Fair 97.2% |
| Immigrants | Uganda | 21.1 /100 | #198 | Fair 97.2% |
| Natives/Alaskans | 18.0 /100 | #199 | Poor 97.2% |
| Immigrants | Northern Africa | 16.8 /100 | #200 | Poor 97.2% |
| Immigrants | Chile | 16.6 /100 | #201 | Poor 97.2% |
| Africans | 15.3 /100 | #202 | Poor 97.2% |
| Immigrants | Bahamas | 14.9 /100 | #203 | Poor 97.2% |
| Immigrants | Zaire | 13.7 /100 | #204 | Poor 97.1% |
| Moroccans | 12.0 /100 | #205 | Poor 97.1% |
| Paiute | 11.6 /100 | #206 | Poor 97.1% |
| Iraqis | 10.9 /100 | #207 | Poor 97.1% |
| Laotians | 10.8 /100 | #208 | Poor 97.1% |
Demographics Similar to Belgians by 5th Grade
In terms of 5th grade, the demographic groups most similar to Belgians are Latvian (98.1%, a difference of 0.010%), Luxembourger (98.1%, a difference of 0.010%), Eastern European (98.1%, a difference of 0.010%), British (98.1%, a difference of 0.030%), and Italian (98.1%, a difference of 0.040%).
| Demographics | Rating | Rank | 5th Grade |
| Europeans | 100.0 /100 | #31 | Exceptional 98.2% |
| Chippewa | 100.0 /100 | #32 | Exceptional 98.1% |
| Swiss | 100.0 /100 | #33 | Exceptional 98.1% |
| Chinese | 100.0 /100 | #34 | Exceptional 98.1% |
| Italians | 100.0 /100 | #35 | Exceptional 98.1% |
| British | 100.0 /100 | #36 | Exceptional 98.1% |
| Latvians | 99.9 /100 | #37 | Exceptional 98.1% |
| Belgians | 99.9 /100 | #38 | Exceptional 98.1% |
| Luxembourgers | 99.9 /100 | #39 | Exceptional 98.1% |
| Eastern Europeans | 99.9 /100 | #40 | Exceptional 98.1% |
| Hungarians | 99.9 /100 | #41 | Exceptional 98.0% |
| Northern Europeans | 99.9 /100 | #42 | Exceptional 98.0% |
| Ottawa | 99.9 /100 | #43 | Exceptional 98.0% |
| Aleuts | 99.9 /100 | #44 | Exceptional 98.0% |
| Czechoslovakians | 99.9 /100 | #45 | Exceptional 98.0% |