Immigrants from Kazakhstan vs Dutch West Indian 4th Grade
COMPARE
Immigrants from Kazakhstan
Dutch West Indian
4th Grade
4th Grade Comparison
Immigrants from Kazakhstan
Dutch West Indians
97.5%
4TH GRADE
43.6/ 100
METRIC RATING
179th/ 347
METRIC RANK
97.5%
4TH GRADE
35.8/ 100
METRIC RATING
186th/ 347
METRIC RANK
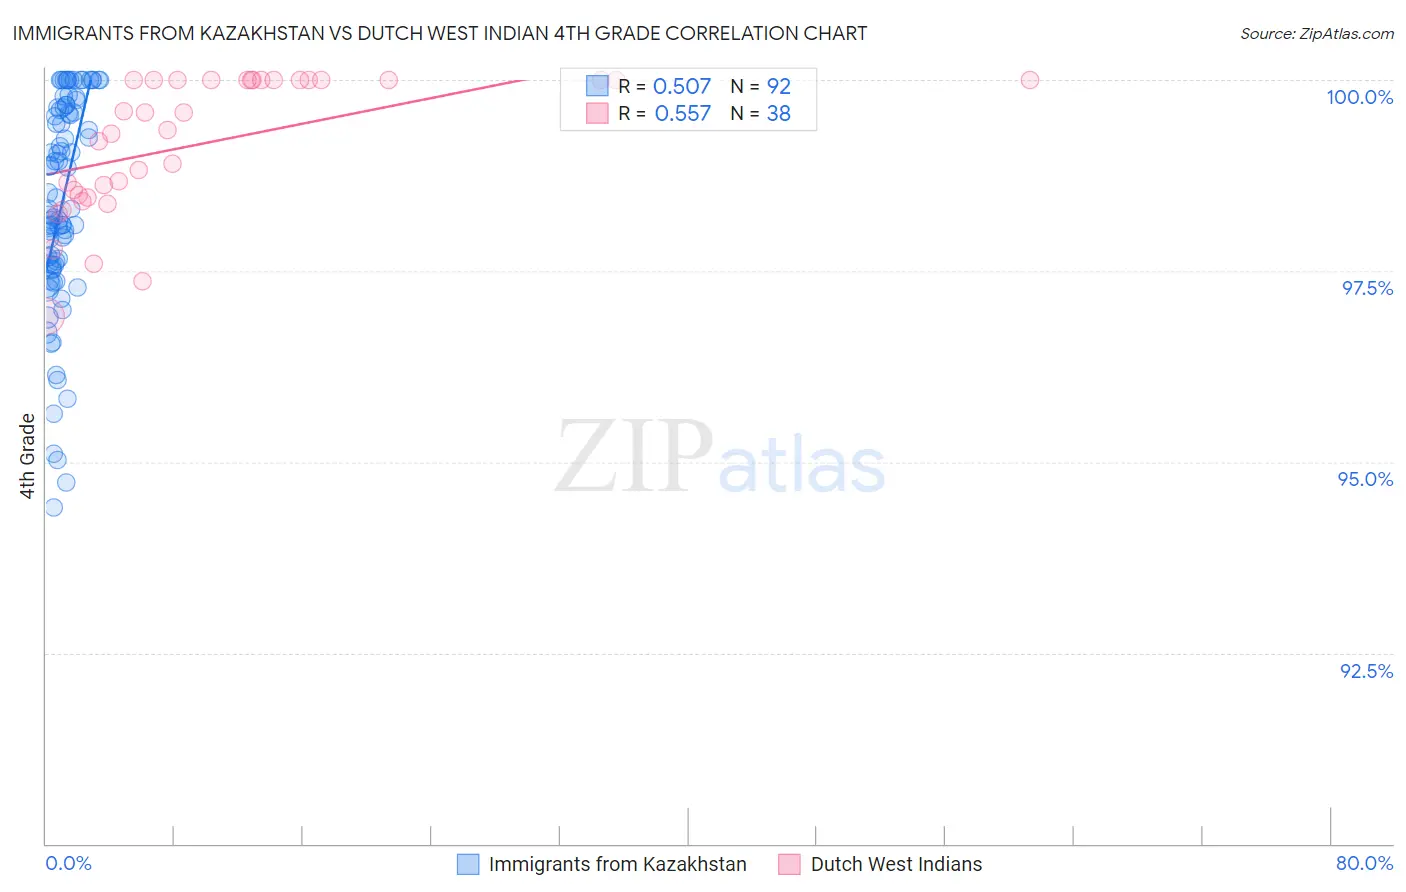
Immigrants from Kazakhstan vs Dutch West Indian 4th Grade Correlation Chart
The statistical analysis conducted on geographies consisting of 124,430,097 people shows a substantial positive correlation between the proportion of Immigrants from Kazakhstan and percentage of population with at least 4th grade education in the United States with a correlation coefficient (R) of 0.507 and weighted average of 97.5%. Similarly, the statistical analysis conducted on geographies consisting of 85,776,075 people shows a substantial positive correlation between the proportion of Dutch West Indians and percentage of population with at least 4th grade education in the United States with a correlation coefficient (R) of 0.557 and weighted average of 97.5%, a difference of 0.030%.
4th Grade Correlation Summary
| Measurement | Immigrants from Kazakhstan | Dutch West Indian |
| Minimum | 94.4% | 96.9% |
| Maximum | 100.0% | 100.0% |
| Range | 5.6% | 3.1% |
| Mean | 98.4% | 99.2% |
| Median | 98.3% | 99.5% |
| Interquartile 25% (IQ1) | 97.6% | 98.5% |
| Interquartile 75% (IQ3) | 99.6% | 100.0% |
| Interquartile Range (IQR) | 2.0% | 1.5% |
| Standard Deviation (Sample) | 1.4% | 0.89% |
| Standard Deviation (Population) | 1.4% | 0.88% |
Demographics Similar to Immigrants from Kazakhstan and Dutch West Indians by 4th Grade
In terms of 4th grade, the demographic groups most similar to Immigrants from Kazakhstan are Immigrants from Venezuela (97.5%, a difference of 0.0%), Immigrants from Brazil (97.5%, a difference of 0.010%), Comanche (97.5%, a difference of 0.010%), Immigrants from Taiwan (97.5%, a difference of 0.010%), and Egyptian (97.5%, a difference of 0.020%). Similarly, the demographic groups most similar to Dutch West Indians are Pakistani (97.5%, a difference of 0.0%), Immigrants from Kenya (97.5%, a difference of 0.0%), Mongolian (97.5%, a difference of 0.0%), Immigrants from Argentina (97.5%, a difference of 0.0%), and Spanish American (97.5%, a difference of 0.010%).
| Demographics | Rating | Rank | 4th Grade |
| Immigrants | Sri Lanka | 51.1 /100 | #172 | Average 97.5% |
| Immigrants | Korea | 50.6 /100 | #173 | Average 97.5% |
| Egyptians | 50.0 /100 | #174 | Average 97.5% |
| Immigrants | Micronesia | 49.6 /100 | #175 | Average 97.5% |
| Arabs | 48.7 /100 | #176 | Average 97.5% |
| Immigrants | Brazil | 46.1 /100 | #177 | Average 97.5% |
| Comanche | 45.3 /100 | #178 | Average 97.5% |
| Immigrants | Kazakhstan | 43.6 /100 | #179 | Average 97.5% |
| Immigrants | Venezuela | 42.7 /100 | #180 | Average 97.5% |
| Immigrants | Taiwan | 41.5 /100 | #181 | Average 97.5% |
| Spanish Americans | 39.3 /100 | #182 | Fair 97.5% |
| Argentineans | 39.0 /100 | #183 | Fair 97.5% |
| Pakistanis | 36.2 /100 | #184 | Fair 97.5% |
| Immigrants | Kenya | 35.8 /100 | #185 | Fair 97.5% |
| Dutch West Indians | 35.8 /100 | #186 | Fair 97.5% |
| Mongolians | 34.7 /100 | #187 | Fair 97.5% |
| Immigrants | Argentina | 34.6 /100 | #188 | Fair 97.5% |
| Panamanians | 31.9 /100 | #189 | Fair 97.4% |
| Blacks/African Americans | 31.1 /100 | #190 | Fair 97.4% |
| Navajo | 30.7 /100 | #191 | Fair 97.4% |
| Immigrants | Ukraine | 30.1 /100 | #192 | Fair 97.4% |