Scottish vs African 5th Grade
COMPARE
Scottish
African
5th Grade
5th Grade Comparison
Scottish
Africans
98.3%
5TH GRADE
100.0/ 100
METRIC RATING
15th/ 347
METRIC RANK
97.2%
5TH GRADE
15.3/ 100
METRIC RATING
202nd/ 347
METRIC RANK
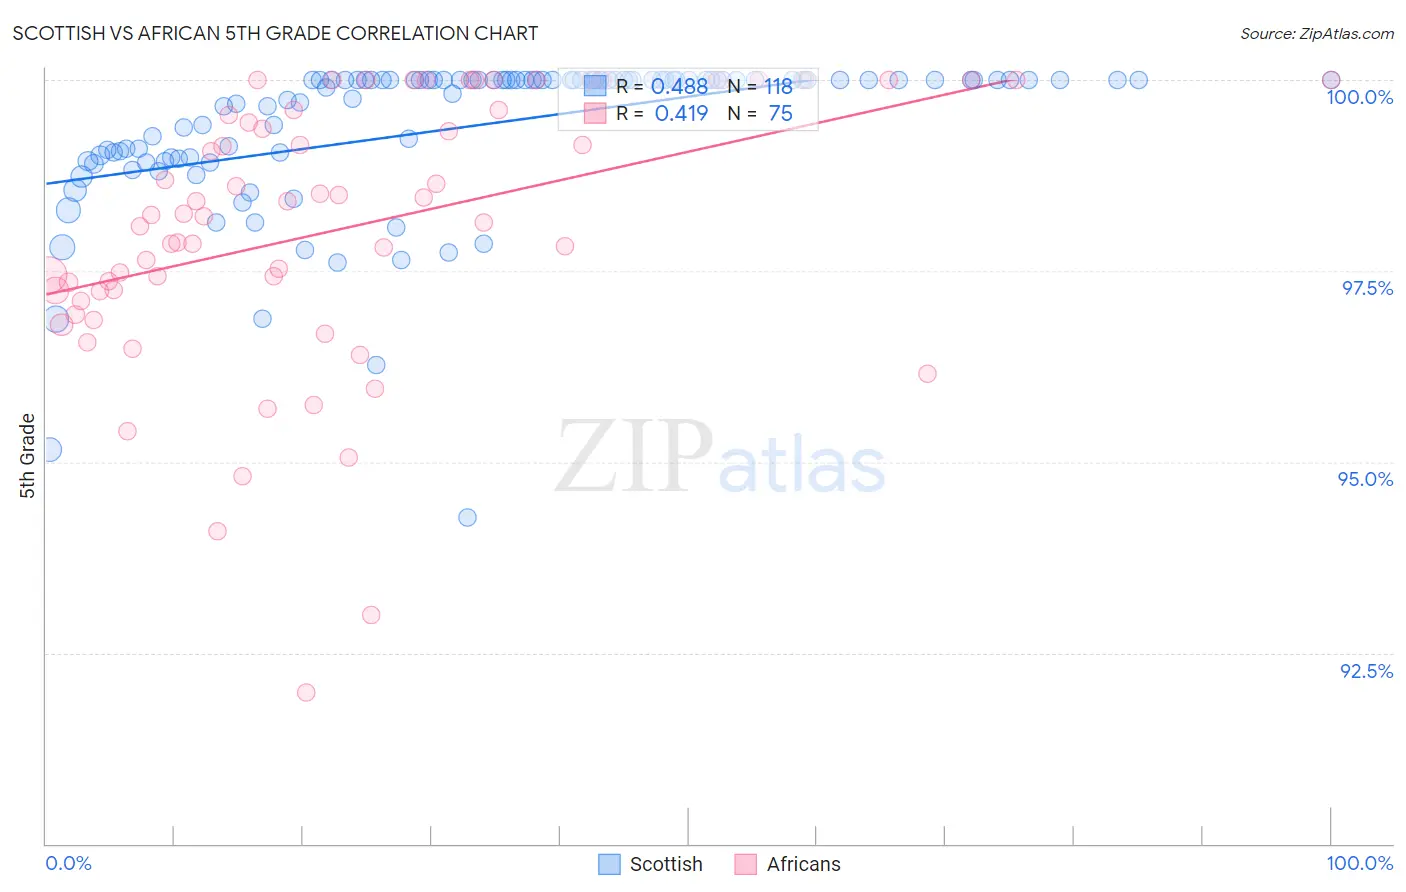
Scottish vs African 5th Grade Correlation Chart
The statistical analysis conducted on geographies consisting of 567,141,733 people shows a moderate positive correlation between the proportion of Scottish and percentage of population with at least 5th grade education in the United States with a correlation coefficient (R) of 0.488 and weighted average of 98.3%. Similarly, the statistical analysis conducted on geographies consisting of 470,094,744 people shows a moderate positive correlation between the proportion of Africans and percentage of population with at least 5th grade education in the United States with a correlation coefficient (R) of 0.419 and weighted average of 97.2%, a difference of 1.1%.
5th Grade Correlation Summary
| Measurement | Scottish | African |
| Minimum | 94.3% | 92.0% |
| Maximum | 100.0% | 100.0% |
| Range | 5.7% | 8.0% |
| Mean | 99.4% | 98.1% |
| Median | 100.0% | 98.2% |
| Interquartile 25% (IQ1) | 99.0% | 97.2% |
| Interquartile 75% (IQ3) | 100.0% | 99.6% |
| Interquartile Range (IQR) | 1.0% | 2.4% |
| Standard Deviation (Sample) | 1.0% | 1.8% |
| Standard Deviation (Population) | 1.0% | 1.8% |
Similar Demographics by 5th Grade
Demographics Similar to Scottish by 5th Grade
In terms of 5th grade, the demographic groups most similar to Scottish are Dutch (98.3%, a difference of 0.010%), Polish (98.3%, a difference of 0.010%), Tlingit-Haida (98.3%, a difference of 0.020%), Irish (98.3%, a difference of 0.020%), and Pennsylvania German (98.3%, a difference of 0.020%).
| Demographics | Rating | Rank | 5th Grade |
| Slovenes | 100.0 /100 | #8 | Exceptional 98.3% |
| Swedes | 100.0 /100 | #9 | Exceptional 98.3% |
| English | 100.0 /100 | #10 | Exceptional 98.3% |
| Alaskan Athabascans | 100.0 /100 | #11 | Exceptional 98.3% |
| Carpatho Rusyns | 100.0 /100 | #12 | Exceptional 98.3% |
| Tlingit-Haida | 100.0 /100 | #13 | Exceptional 98.3% |
| Dutch | 100.0 /100 | #14 | Exceptional 98.3% |
| Scottish | 100.0 /100 | #15 | Exceptional 98.3% |
| Poles | 100.0 /100 | #16 | Exceptional 98.3% |
| Irish | 100.0 /100 | #17 | Exceptional 98.3% |
| Pennsylvania Germans | 100.0 /100 | #18 | Exceptional 98.3% |
| Finns | 100.0 /100 | #19 | Exceptional 98.2% |
| Lithuanians | 100.0 /100 | #20 | Exceptional 98.2% |
| Danes | 100.0 /100 | #21 | Exceptional 98.2% |
| Croatians | 100.0 /100 | #22 | Exceptional 98.2% |
Demographics Similar to Africans by 5th Grade
In terms of 5th grade, the demographic groups most similar to Africans are Immigrants from Bahamas (97.2%, a difference of 0.0%), Immigrants from Northern Africa (97.2%, a difference of 0.010%), Immigrants from Chile (97.2%, a difference of 0.010%), Immigrants from Zaire (97.1%, a difference of 0.010%), and Native/Alaskan (97.2%, a difference of 0.020%).
| Demographics | Rating | Rank | 5th Grade |
| Guamanians/Chamorros | 26.8 /100 | #195 | Fair 97.2% |
| Hawaiians | 25.6 /100 | #196 | Fair 97.2% |
| Brazilians | 25.4 /100 | #197 | Fair 97.2% |
| Immigrants | Uganda | 21.1 /100 | #198 | Fair 97.2% |
| Natives/Alaskans | 18.0 /100 | #199 | Poor 97.2% |
| Immigrants | Northern Africa | 16.8 /100 | #200 | Poor 97.2% |
| Immigrants | Chile | 16.6 /100 | #201 | Poor 97.2% |
| Africans | 15.3 /100 | #202 | Poor 97.2% |
| Immigrants | Bahamas | 14.9 /100 | #203 | Poor 97.2% |
| Immigrants | Zaire | 13.7 /100 | #204 | Poor 97.1% |
| Moroccans | 12.0 /100 | #205 | Poor 97.1% |
| Paiute | 11.6 /100 | #206 | Poor 97.1% |
| Iraqis | 10.9 /100 | #207 | Poor 97.1% |
| Laotians | 10.8 /100 | #208 | Poor 97.1% |
| Immigrants | Nepal | 10.3 /100 | #209 | Poor 97.1% |