Immigrants from Zimbabwe vs Honduran 10th Grade
COMPARE
Immigrants from Zimbabwe
Honduran
10th Grade
10th Grade Comparison
Immigrants from Zimbabwe
Hondurans
94.4%
10TH GRADE
96.8/ 100
METRIC RATING
111th/ 347
METRIC RANK
89.0%
10TH GRADE
0.0/ 100
METRIC RATING
333rd/ 347
METRIC RANK
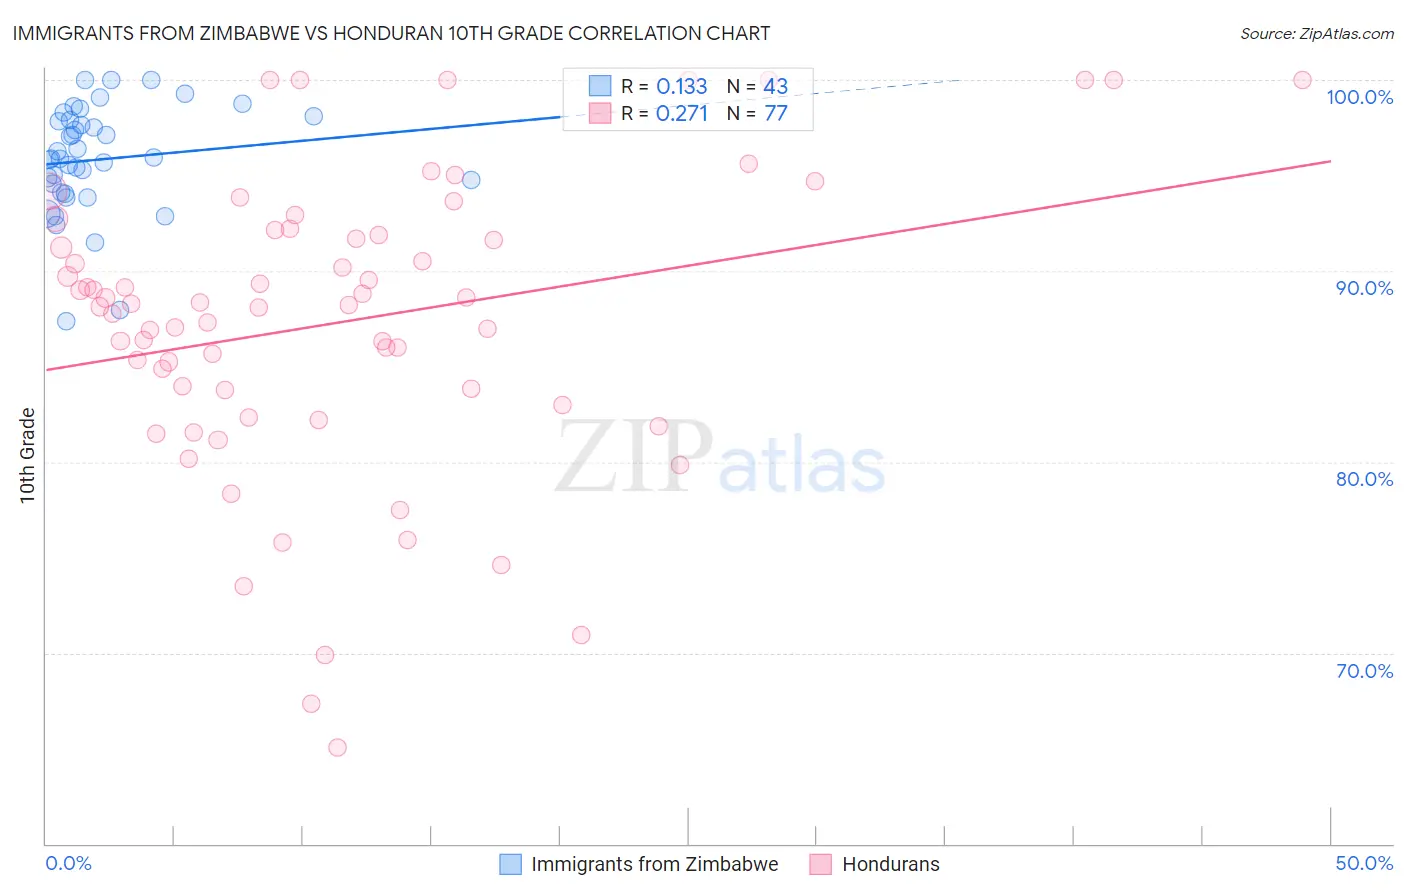
Immigrants from Zimbabwe vs Honduran 10th Grade Correlation Chart
The statistical analysis conducted on geographies consisting of 117,809,691 people shows a poor positive correlation between the proportion of Immigrants from Zimbabwe and percentage of population with at least 10th grade education in the United States with a correlation coefficient (R) of 0.133 and weighted average of 94.4%. Similarly, the statistical analysis conducted on geographies consisting of 357,858,827 people shows a weak positive correlation between the proportion of Hondurans and percentage of population with at least 10th grade education in the United States with a correlation coefficient (R) of 0.271 and weighted average of 89.0%, a difference of 6.2%.
10th Grade Correlation Summary
| Measurement | Immigrants from Zimbabwe | Honduran |
| Minimum | 87.3% | 65.0% |
| Maximum | 100.0% | 100.0% |
| Range | 12.7% | 35.0% |
| Mean | 95.8% | 87.3% |
| Median | 95.9% | 88.2% |
| Interquartile 25% (IQ1) | 94.1% | 83.4% |
| Interquartile 75% (IQ3) | 97.9% | 92.0% |
| Interquartile Range (IQR) | 3.8% | 8.6% |
| Standard Deviation (Sample) | 2.8% | 7.7% |
| Standard Deviation (Population) | 2.8% | 7.7% |
Similar Demographics by 10th Grade
Demographics Similar to Immigrants from Zimbabwe by 10th Grade
In terms of 10th grade, the demographic groups most similar to Immigrants from Zimbabwe are Immigrants from Kuwait (94.4%, a difference of 0.010%), Burmese (94.5%, a difference of 0.020%), Palestinian (94.4%, a difference of 0.020%), Immigrants from North Macedonia (94.5%, a difference of 0.030%), and Immigrants from Norway (94.5%, a difference of 0.030%).
| Demographics | Rating | Rank | 10th Grade |
| Immigrants | Romania | 97.5 /100 | #104 | Exceptional 94.5% |
| Immigrants | Turkey | 97.4 /100 | #105 | Exceptional 94.5% |
| Immigrants | Serbia | 97.4 /100 | #106 | Exceptional 94.5% |
| Immigrants | Croatia | 97.4 /100 | #107 | Exceptional 94.5% |
| Immigrants | North Macedonia | 97.2 /100 | #108 | Exceptional 94.5% |
| Immigrants | Norway | 97.2 /100 | #109 | Exceptional 94.5% |
| Burmese | 97.1 /100 | #110 | Exceptional 94.5% |
| Immigrants | Zimbabwe | 96.8 /100 | #111 | Exceptional 94.4% |
| Immigrants | Kuwait | 96.8 /100 | #112 | Exceptional 94.4% |
| Palestinians | 96.5 /100 | #113 | Exceptional 94.4% |
| German Russians | 96.3 /100 | #114 | Exceptional 94.4% |
| Delaware | 96.3 /100 | #115 | Exceptional 94.4% |
| Sioux | 96.2 /100 | #116 | Exceptional 94.4% |
| Immigrants | Hungary | 95.8 /100 | #117 | Exceptional 94.4% |
| Jordanians | 95.6 /100 | #118 | Exceptional 94.4% |
Demographics Similar to Hondurans by 10th Grade
In terms of 10th grade, the demographic groups most similar to Hondurans are Immigrants from the Azores (89.0%, a difference of 0.030%), Mexican American Indian (89.0%, a difference of 0.070%), Immigrants from Yemen (89.1%, a difference of 0.10%), Hispanic or Latino (88.9%, a difference of 0.12%), and Immigrants from Dominican Republic (88.7%, a difference of 0.30%).
| Demographics | Rating | Rank | 10th Grade |
| Central American Indians | 0.0 /100 | #326 | Tragic 89.7% |
| Immigrants | Nicaragua | 0.0 /100 | #327 | Tragic 89.5% |
| Immigrants | Cabo Verde | 0.0 /100 | #328 | Tragic 89.5% |
| Dominicans | 0.0 /100 | #329 | Tragic 89.4% |
| Immigrants | Yemen | 0.0 /100 | #330 | Tragic 89.1% |
| Mexican American Indians | 0.0 /100 | #331 | Tragic 89.0% |
| Immigrants | Azores | 0.0 /100 | #332 | Tragic 89.0% |
| Hondurans | 0.0 /100 | #333 | Tragic 89.0% |
| Hispanics or Latinos | 0.0 /100 | #334 | Tragic 88.9% |
| Immigrants | Dominican Republic | 0.0 /100 | #335 | Tragic 88.7% |
| Immigrants | Honduras | 0.0 /100 | #336 | Tragic 88.5% |
| Central Americans | 0.0 /100 | #337 | Tragic 88.4% |
| Immigrants | Latin America | 0.0 /100 | #338 | Tragic 88.3% |
| Guatemalans | 0.0 /100 | #339 | Tragic 87.9% |
| Mexicans | 0.0 /100 | #340 | Tragic 87.8% |