Immigrants from Dominica vs Honduran 10th Grade
COMPARE
Immigrants from Dominica
Honduran
10th Grade
10th Grade Comparison
Immigrants from Dominica
Hondurans
91.1%
10TH GRADE
0.0/ 100
METRIC RATING
305th/ 347
METRIC RANK
89.0%
10TH GRADE
0.0/ 100
METRIC RATING
333rd/ 347
METRIC RANK
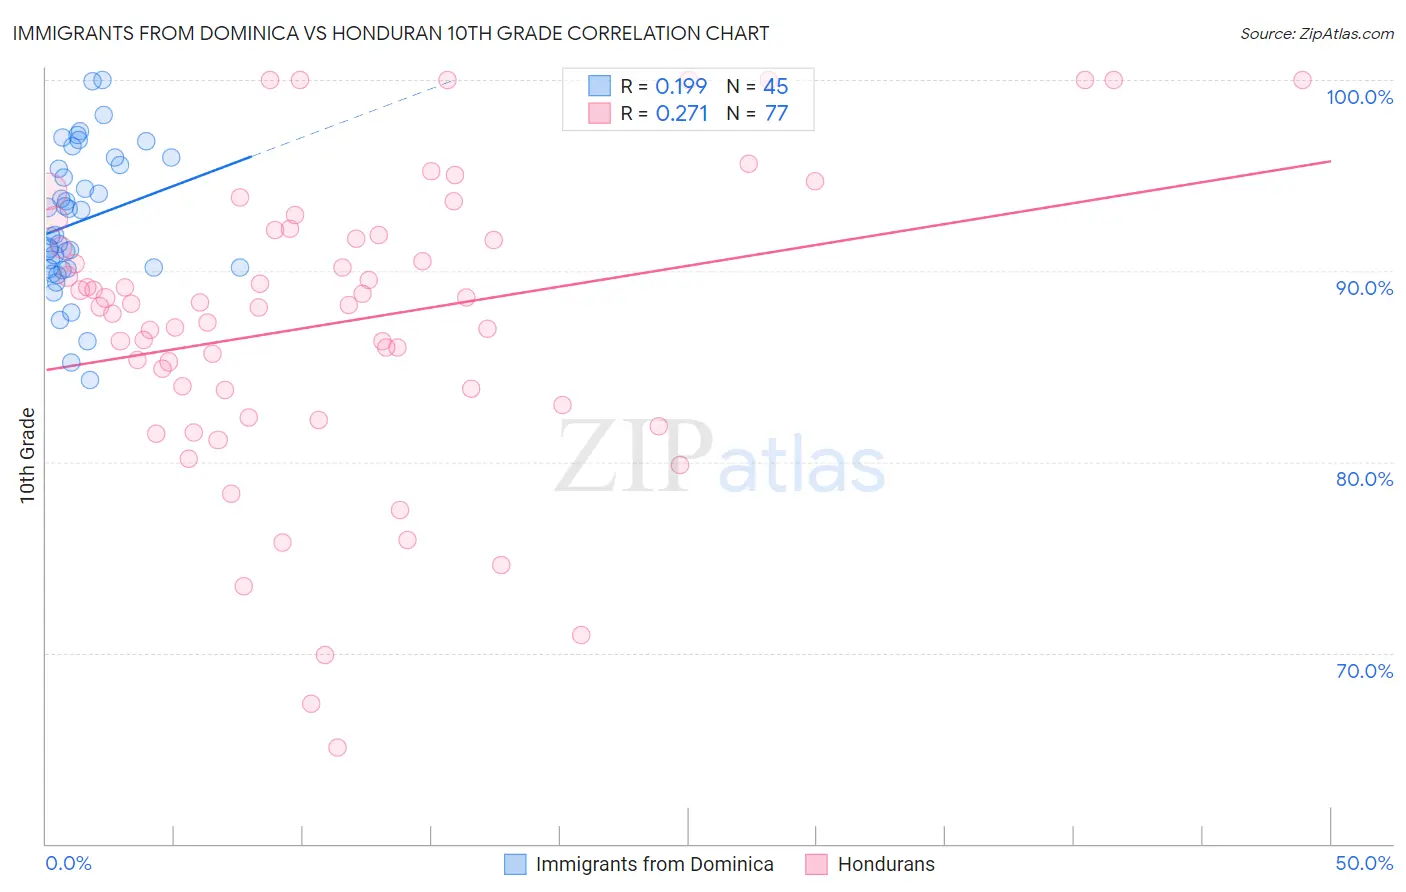
Immigrants from Dominica vs Honduran 10th Grade Correlation Chart
The statistical analysis conducted on geographies consisting of 83,794,115 people shows a poor positive correlation between the proportion of Immigrants from Dominica and percentage of population with at least 10th grade education in the United States with a correlation coefficient (R) of 0.199 and weighted average of 91.1%. Similarly, the statistical analysis conducted on geographies consisting of 357,858,827 people shows a weak positive correlation between the proportion of Hondurans and percentage of population with at least 10th grade education in the United States with a correlation coefficient (R) of 0.271 and weighted average of 89.0%, a difference of 2.4%.
10th Grade Correlation Summary
| Measurement | Immigrants from Dominica | Honduran |
| Minimum | 84.3% | 65.0% |
| Maximum | 100.0% | 100.0% |
| Range | 15.7% | 35.0% |
| Mean | 92.6% | 87.3% |
| Median | 91.9% | 88.2% |
| Interquartile 25% (IQ1) | 90.1% | 83.4% |
| Interquartile 75% (IQ3) | 95.7% | 92.0% |
| Interquartile Range (IQR) | 5.6% | 8.6% |
| Standard Deviation (Sample) | 3.7% | 7.7% |
| Standard Deviation (Population) | 3.7% | 7.7% |
Similar Demographics by 10th Grade
Demographics Similar to Immigrants from Dominica by 10th Grade
In terms of 10th grade, the demographic groups most similar to Immigrants from Dominica are Pima (91.2%, a difference of 0.020%), Yaqui (91.1%, a difference of 0.060%), Immigrants from Vietnam (91.2%, a difference of 0.070%), Immigrants from Guyana (91.2%, a difference of 0.090%), and Japanese (91.2%, a difference of 0.10%).
| Demographics | Rating | Rank | 10th Grade |
| Cubans | 0.0 /100 | #298 | Tragic 91.5% |
| Immigrants | Haiti | 0.0 /100 | #299 | Tragic 91.4% |
| Guyanese | 0.0 /100 | #300 | Tragic 91.4% |
| Japanese | 0.0 /100 | #301 | Tragic 91.2% |
| Immigrants | Guyana | 0.0 /100 | #302 | Tragic 91.2% |
| Immigrants | Vietnam | 0.0 /100 | #303 | Tragic 91.2% |
| Pima | 0.0 /100 | #304 | Tragic 91.2% |
| Immigrants | Dominica | 0.0 /100 | #305 | Tragic 91.1% |
| Yaqui | 0.0 /100 | #306 | Tragic 91.1% |
| Immigrants | Fiji | 0.0 /100 | #307 | Tragic 91.0% |
| Immigrants | Bangladesh | 0.0 /100 | #308 | Tragic 91.0% |
| Immigrants | Immigrants | 0.0 /100 | #309 | Tragic 91.0% |
| Vietnamese | 0.0 /100 | #310 | Tragic 90.9% |
| Immigrants | Cambodia | 0.0 /100 | #311 | Tragic 90.9% |
| Immigrants | Portugal | 0.0 /100 | #312 | Tragic 90.8% |
Demographics Similar to Hondurans by 10th Grade
In terms of 10th grade, the demographic groups most similar to Hondurans are Immigrants from the Azores (89.0%, a difference of 0.030%), Mexican American Indian (89.0%, a difference of 0.070%), Immigrants from Yemen (89.1%, a difference of 0.10%), Hispanic or Latino (88.9%, a difference of 0.12%), and Immigrants from Dominican Republic (88.7%, a difference of 0.30%).
| Demographics | Rating | Rank | 10th Grade |
| Central American Indians | 0.0 /100 | #326 | Tragic 89.7% |
| Immigrants | Nicaragua | 0.0 /100 | #327 | Tragic 89.5% |
| Immigrants | Cabo Verde | 0.0 /100 | #328 | Tragic 89.5% |
| Dominicans | 0.0 /100 | #329 | Tragic 89.4% |
| Immigrants | Yemen | 0.0 /100 | #330 | Tragic 89.1% |
| Mexican American Indians | 0.0 /100 | #331 | Tragic 89.0% |
| Immigrants | Azores | 0.0 /100 | #332 | Tragic 89.0% |
| Hondurans | 0.0 /100 | #333 | Tragic 89.0% |
| Hispanics or Latinos | 0.0 /100 | #334 | Tragic 88.9% |
| Immigrants | Dominican Republic | 0.0 /100 | #335 | Tragic 88.7% |
| Immigrants | Honduras | 0.0 /100 | #336 | Tragic 88.5% |
| Central Americans | 0.0 /100 | #337 | Tragic 88.4% |
| Immigrants | Latin America | 0.0 /100 | #338 | Tragic 88.3% |
| Guatemalans | 0.0 /100 | #339 | Tragic 87.9% |
| Mexicans | 0.0 /100 | #340 | Tragic 87.8% |