Brazilian vs Kenyan College, Under 1 year
COMPARE
Brazilian
Kenyan
College, Under 1 year
College, Under 1 year Comparison
Brazilians
Kenyans
65.9%
COLLEGE, UNDER 1 YEAR
66.0/ 100
METRIC RATING
161st/ 347
METRIC RANK
66.5%
COLLEGE, UNDER 1 YEAR
81.7/ 100
METRIC RATING
146th/ 347
METRIC RANK
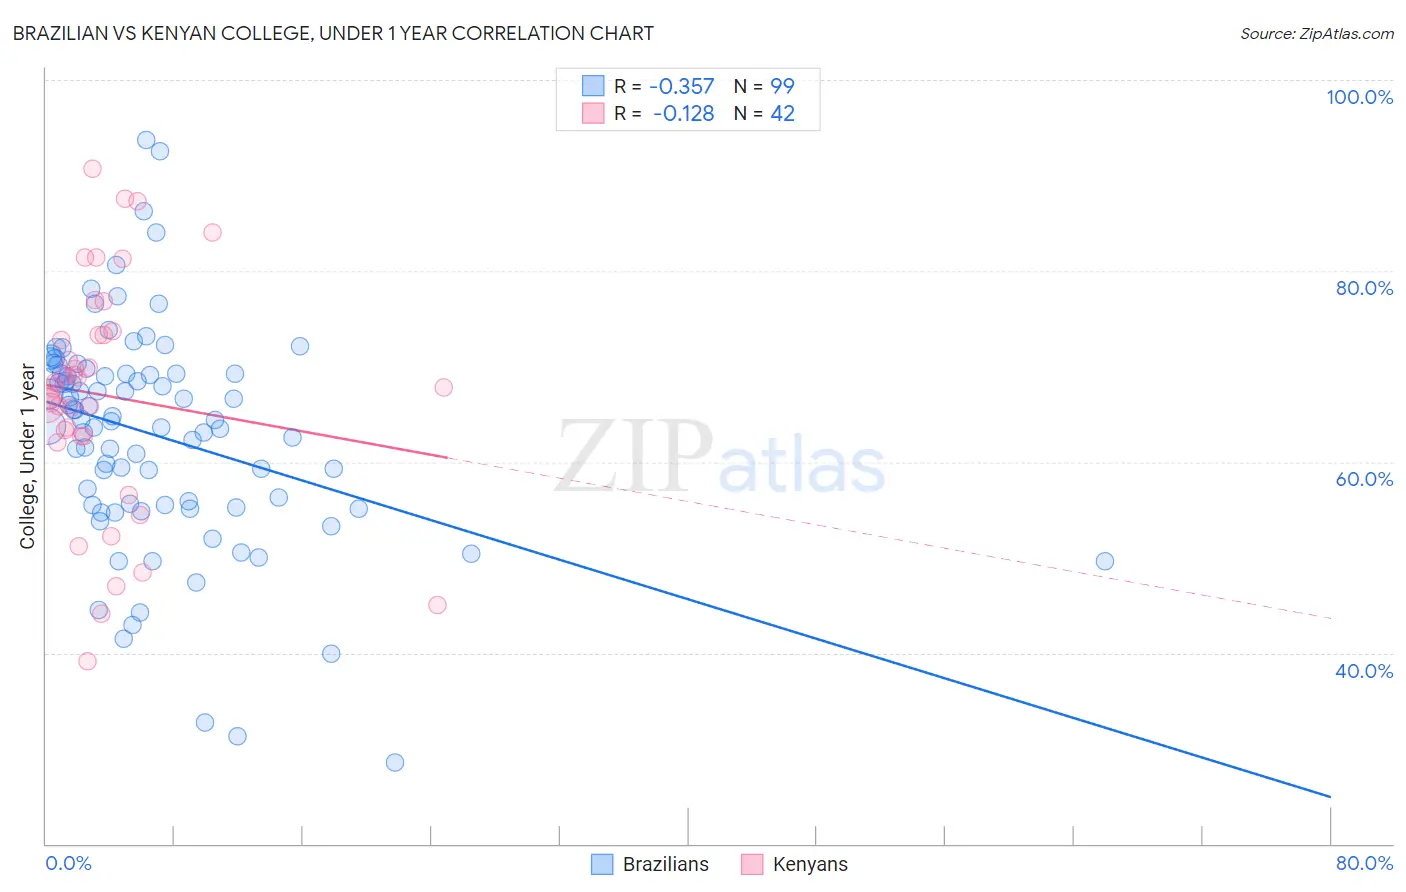
Brazilian vs Kenyan College, Under 1 year Correlation Chart
The statistical analysis conducted on geographies consisting of 323,962,626 people shows a mild negative correlation between the proportion of Brazilians and percentage of population with at least college, under 1 year education in the United States with a correlation coefficient (R) of -0.357 and weighted average of 65.9%. Similarly, the statistical analysis conducted on geographies consisting of 168,244,481 people shows a poor negative correlation between the proportion of Kenyans and percentage of population with at least college, under 1 year education in the United States with a correlation coefficient (R) of -0.128 and weighted average of 66.5%, a difference of 0.91%.
College, Under 1 year Correlation Summary
| Measurement | Brazilian | Kenyan |
| Minimum | 28.5% | 39.1% |
| Maximum | 93.7% | 90.7% |
| Range | 65.2% | 51.6% |
| Mean | 62.8% | 66.9% |
| Median | 64.4% | 67.8% |
| Interquartile 25% (IQ1) | 55.5% | 62.7% |
| Interquartile 75% (IQ3) | 69.3% | 73.3% |
| Interquartile Range (IQR) | 13.8% | 10.6% |
| Standard Deviation (Sample) | 11.6% | 12.2% |
| Standard Deviation (Population) | 11.5% | 12.0% |
Demographics Similar to Brazilians and Kenyans by College, Under 1 year
In terms of college, under 1 year, the demographic groups most similar to Brazilians are Albanian (65.9%, a difference of 0.010%), Tlingit-Haida (65.9%, a difference of 0.020%), Korean (65.9%, a difference of 0.030%), Celtic (65.9%, a difference of 0.070%), and Sierra Leonean (66.0%, a difference of 0.090%). Similarly, the demographic groups most similar to Kenyans are Immigrants from Kenya (66.5%, a difference of 0.0%), Immigrants from Morocco (66.5%, a difference of 0.0%), Immigrants from Germany (66.5%, a difference of 0.020%), Immigrants from Uganda (66.5%, a difference of 0.080%), and Taiwanese (66.4%, a difference of 0.21%).
| Demographics | Rating | Rank | College, Under 1 year |
| Immigrants | Uganda | 82.8 /100 | #143 | Excellent 66.5% |
| Immigrants | Germany | 82.0 /100 | #144 | Excellent 66.5% |
| Immigrants | Kenya | 81.8 /100 | #145 | Excellent 66.5% |
| Kenyans | 81.7 /100 | #146 | Excellent 66.5% |
| Immigrants | Morocco | 81.7 /100 | #147 | Excellent 66.5% |
| Taiwanese | 78.6 /100 | #148 | Good 66.4% |
| Immigrants | Venezuela | 77.9 /100 | #149 | Good 66.3% |
| Immigrants | Iraq | 77.1 /100 | #150 | Good 66.3% |
| Immigrants | Sudan | 76.0 /100 | #151 | Good 66.2% |
| Sudanese | 74.1 /100 | #152 | Good 66.2% |
| Belgians | 73.7 /100 | #153 | Good 66.2% |
| Immigrants | Eritrea | 71.9 /100 | #154 | Good 66.1% |
| Irish | 70.3 /100 | #155 | Good 66.0% |
| Welsh | 69.9 /100 | #156 | Good 66.0% |
| Sierra Leoneans | 67.8 /100 | #157 | Good 66.0% |
| Celtics | 67.3 /100 | #158 | Good 65.9% |
| Tlingit-Haida | 66.4 /100 | #159 | Good 65.9% |
| Albanians | 66.1 /100 | #160 | Good 65.9% |
| Brazilians | 66.0 /100 | #161 | Good 65.9% |
| Koreans | 65.3 /100 | #162 | Good 65.9% |
| Somalis | 62.7 /100 | #163 | Good 65.8% |