Immigrants from Caribbean vs Somali Kindergarten
COMPARE
Immigrants from Caribbean
Somali
Kindergarten
Kindergarten Comparison
Immigrants from Caribbean
Somalis
97.1%
KINDERGARTEN
0.0/ 100
METRIC RATING
302nd/ 347
METRIC RANK
97.0%
KINDERGARTEN
0.0/ 100
METRIC RATING
303rd/ 347
METRIC RANK
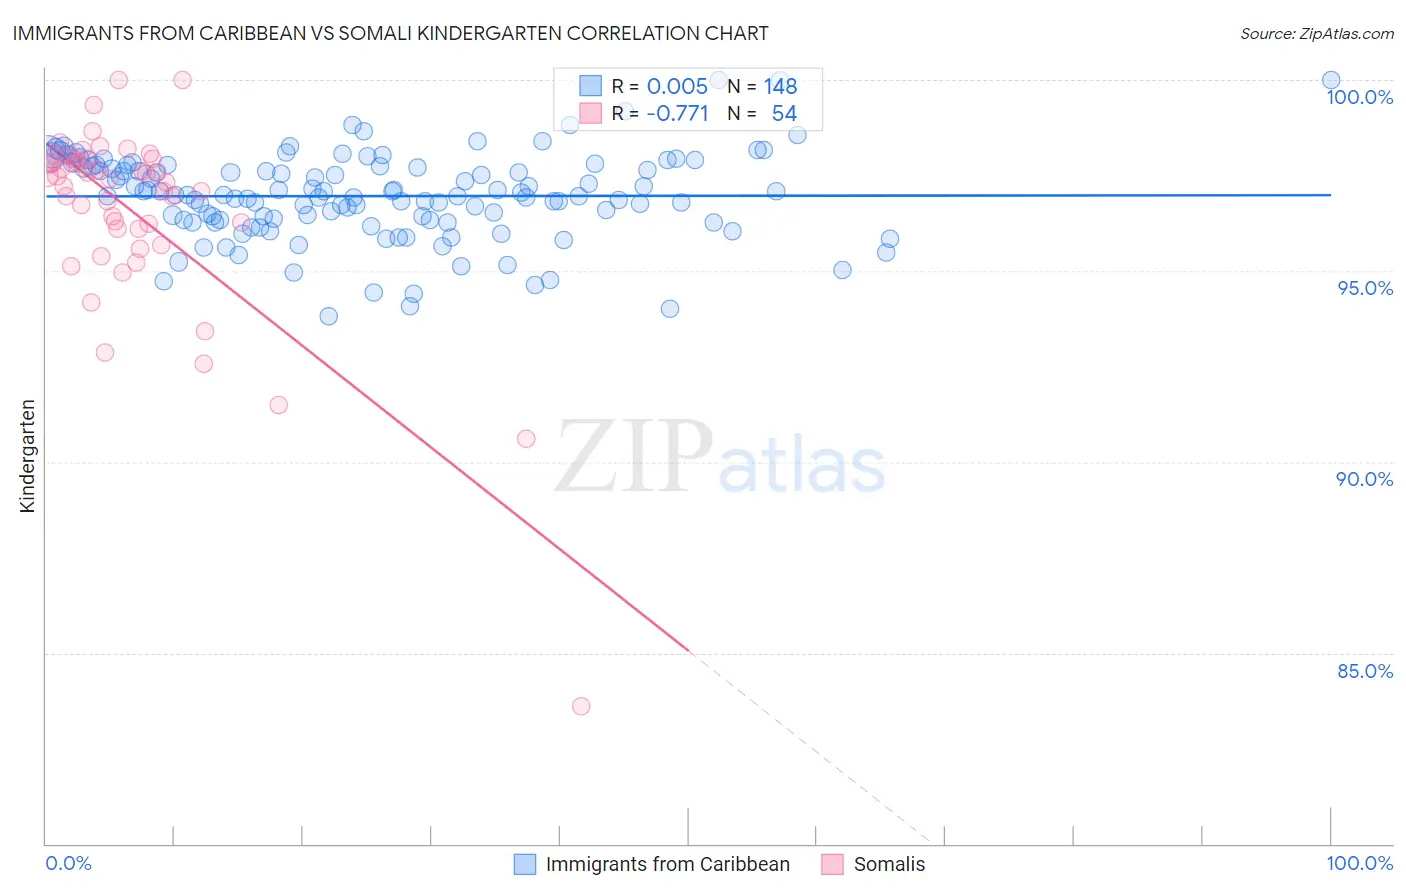
Immigrants from Caribbean vs Somali Kindergarten Correlation Chart
The statistical analysis conducted on geographies consisting of 449,948,226 people shows no correlation between the proportion of Immigrants from Caribbean and percentage of population with at least kindergarten education in the United States with a correlation coefficient (R) of 0.005 and weighted average of 97.1%. Similarly, the statistical analysis conducted on geographies consisting of 99,332,457 people shows a strong negative correlation between the proportion of Somalis and percentage of population with at least kindergarten education in the United States with a correlation coefficient (R) of -0.771 and weighted average of 97.0%, a difference of 0.040%.
Kindergarten Correlation Summary
| Measurement | Immigrants from Caribbean | Somali |
| Minimum | 93.8% | 83.6% |
| Maximum | 100.0% | 100.0% |
| Range | 6.2% | 16.4% |
| Mean | 97.0% | 96.5% |
| Median | 97.0% | 97.4% |
| Interquartile 25% (IQ1) | 96.3% | 96.1% |
| Interquartile 75% (IQ3) | 97.7% | 97.9% |
| Interquartile Range (IQR) | 1.4% | 1.8% |
| Standard Deviation (Sample) | 1.1% | 2.6% |
| Standard Deviation (Population) | 1.1% | 2.6% |
Demographics Similar to Immigrants from Caribbean and Somalis by Kindergarten
In terms of kindergarten, the demographic groups most similar to Immigrants from Caribbean are Immigrants from South Eastern Asia (97.1%, a difference of 0.030%), Nicaraguan (97.0%, a difference of 0.040%), Ecuadorian (97.0%, a difference of 0.040%), Haitian (97.1%, a difference of 0.050%), and Immigrants from Dominica (97.1%, a difference of 0.060%). Similarly, the demographic groups most similar to Somalis are Nicaraguan (97.0%, a difference of 0.0%), Ecuadorian (97.0%, a difference of 0.010%), Belizean (97.0%, a difference of 0.060%), Immigrants from South Eastern Asia (97.1%, a difference of 0.070%), and Hispanic or Latino (97.0%, a difference of 0.070%).
| Demographics | Rating | Rank | Kindergarten |
| British West Indians | 0.0 /100 | #292 | Tragic 97.3% |
| Malaysians | 0.0 /100 | #293 | Tragic 97.2% |
| Immigrants | Immigrants | 0.0 /100 | #294 | Tragic 97.2% |
| Immigrants | Grenada | 0.0 /100 | #295 | Tragic 97.2% |
| Immigrants | Eritrea | 0.0 /100 | #296 | Tragic 97.2% |
| Central American Indians | 0.0 /100 | #297 | Tragic 97.2% |
| Immigrants | Dominica | 0.0 /100 | #298 | Tragic 97.1% |
| Immigrants | Cuba | 0.0 /100 | #299 | Tragic 97.1% |
| Haitians | 0.0 /100 | #300 | Tragic 97.1% |
| Immigrants | South Eastern Asia | 0.0 /100 | #301 | Tragic 97.1% |
| Immigrants | Caribbean | 0.0 /100 | #302 | Tragic 97.1% |
| Somalis | 0.0 /100 | #303 | Tragic 97.0% |
| Nicaraguans | 0.0 /100 | #304 | Tragic 97.0% |
| Ecuadorians | 0.0 /100 | #305 | Tragic 97.0% |
| Belizeans | 0.0 /100 | #306 | Tragic 97.0% |
| Hispanics or Latinos | 0.0 /100 | #307 | Tragic 97.0% |
| Immigrants | Somalia | 0.0 /100 | #308 | Tragic 97.0% |
| Immigrants | Haiti | 0.0 /100 | #309 | Tragic 97.0% |
| Immigrants | Azores | 0.0 /100 | #310 | Tragic 97.0% |
| Sri Lankans | 0.0 /100 | #311 | Tragic 97.0% |
| Guyanese | 0.0 /100 | #312 | Tragic 96.9% |