Immigrants from Caribbean vs Finnish Kindergarten
COMPARE
Immigrants from Caribbean
Finnish
Kindergarten
Kindergarten Comparison
Immigrants from Caribbean
Finns
97.1%
KINDERGARTEN
0.0/ 100
METRIC RATING
302nd/ 347
METRIC RANK
98.6%
KINDERGARTEN
100.0/ 100
METRIC RATING
22nd/ 347
METRIC RANK
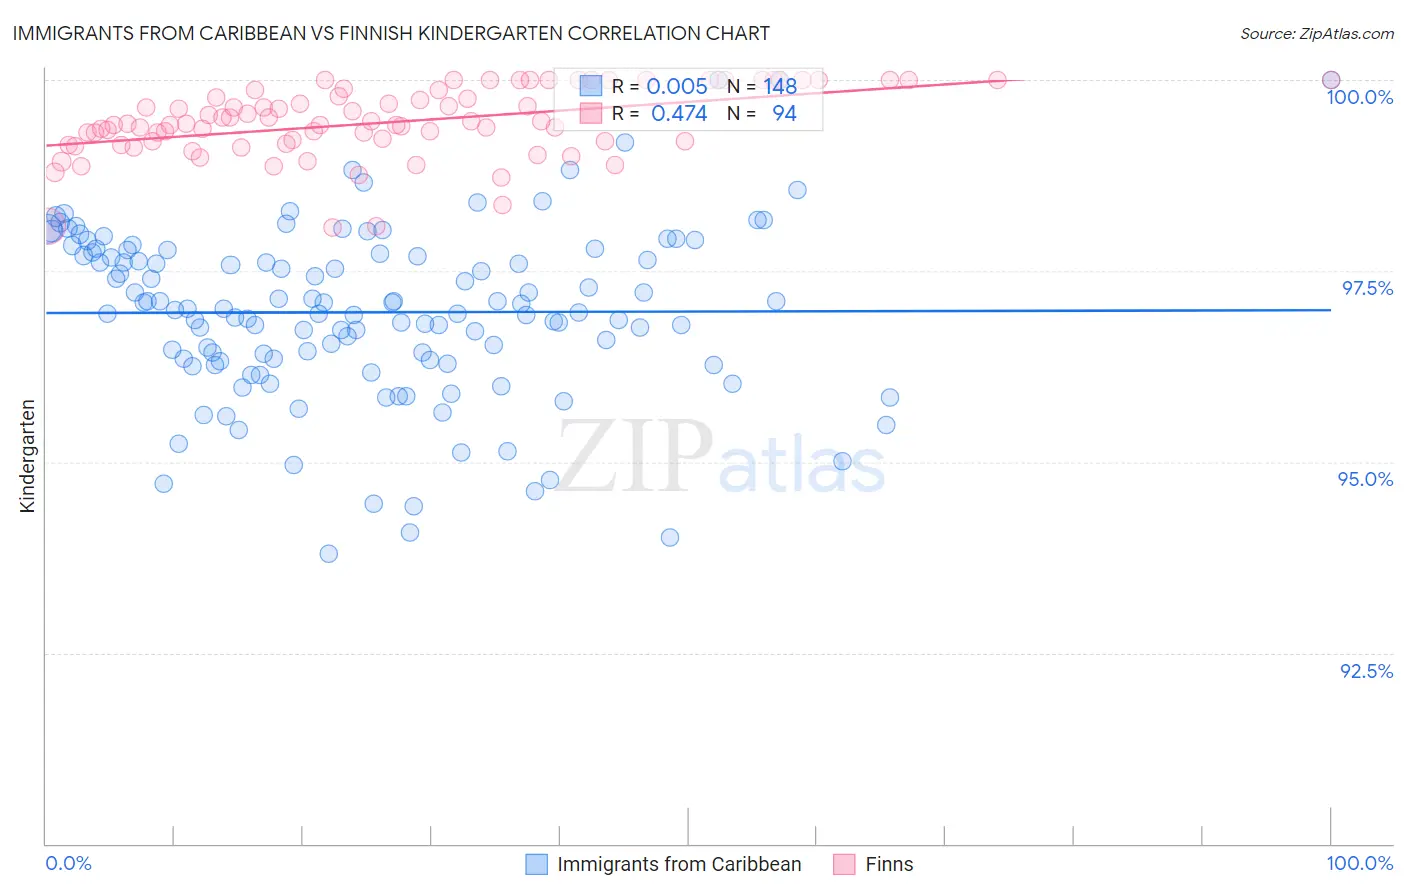
Immigrants from Caribbean vs Finnish Kindergarten Correlation Chart
The statistical analysis conducted on geographies consisting of 449,948,226 people shows no correlation between the proportion of Immigrants from Caribbean and percentage of population with at least kindergarten education in the United States with a correlation coefficient (R) of 0.005 and weighted average of 97.1%. Similarly, the statistical analysis conducted on geographies consisting of 404,675,516 people shows a moderate positive correlation between the proportion of Finns and percentage of population with at least kindergarten education in the United States with a correlation coefficient (R) of 0.474 and weighted average of 98.6%, a difference of 1.6%.
Kindergarten Correlation Summary
| Measurement | Immigrants from Caribbean | Finnish |
| Minimum | 93.8% | 98.1% |
| Maximum | 100.0% | 100.0% |
| Range | 6.2% | 1.9% |
| Mean | 97.0% | 99.4% |
| Median | 97.0% | 99.4% |
| Interquartile 25% (IQ1) | 96.3% | 99.2% |
| Interquartile 75% (IQ3) | 97.7% | 99.9% |
| Interquartile Range (IQR) | 1.4% | 0.68% |
| Standard Deviation (Sample) | 1.1% | 0.46% |
| Standard Deviation (Population) | 1.1% | 0.46% |
Similar Demographics by Kindergarten
Demographics Similar to Immigrants from Caribbean by Kindergarten
In terms of kindergarten, the demographic groups most similar to Immigrants from Caribbean are Immigrants from South Eastern Asia (97.1%, a difference of 0.030%), Somali (97.0%, a difference of 0.040%), Nicaraguan (97.0%, a difference of 0.040%), Ecuadorian (97.0%, a difference of 0.040%), and Haitian (97.1%, a difference of 0.050%).
| Demographics | Rating | Rank | Kindergarten |
| Immigrants | Grenada | 0.0 /100 | #295 | Tragic 97.2% |
| Immigrants | Eritrea | 0.0 /100 | #296 | Tragic 97.2% |
| Central American Indians | 0.0 /100 | #297 | Tragic 97.2% |
| Immigrants | Dominica | 0.0 /100 | #298 | Tragic 97.1% |
| Immigrants | Cuba | 0.0 /100 | #299 | Tragic 97.1% |
| Haitians | 0.0 /100 | #300 | Tragic 97.1% |
| Immigrants | South Eastern Asia | 0.0 /100 | #301 | Tragic 97.1% |
| Immigrants | Caribbean | 0.0 /100 | #302 | Tragic 97.1% |
| Somalis | 0.0 /100 | #303 | Tragic 97.0% |
| Nicaraguans | 0.0 /100 | #304 | Tragic 97.0% |
| Ecuadorians | 0.0 /100 | #305 | Tragic 97.0% |
| Belizeans | 0.0 /100 | #306 | Tragic 97.0% |
| Hispanics or Latinos | 0.0 /100 | #307 | Tragic 97.0% |
| Immigrants | Somalia | 0.0 /100 | #308 | Tragic 97.0% |
| Immigrants | Haiti | 0.0 /100 | #309 | Tragic 97.0% |
Demographics Similar to Finns by Kindergarten
In terms of kindergarten, the demographic groups most similar to Finns are Pennsylvania German (98.6%, a difference of 0.0%), Lithuanian (98.6%, a difference of 0.0%), Arapaho (98.6%, a difference of 0.0%), Danish (98.6%, a difference of 0.0%), and Sioux (98.6%, a difference of 0.0%).
| Demographics | Rating | Rank | Kindergarten |
| Swedes | 100.0 /100 | #15 | Exceptional 98.7% |
| Aleuts | 100.0 /100 | #16 | Exceptional 98.6% |
| Scottish | 100.0 /100 | #17 | Exceptional 98.6% |
| Dutch | 100.0 /100 | #18 | Exceptional 98.6% |
| Irish | 100.0 /100 | #19 | Exceptional 98.6% |
| Pennsylvania Germans | 100.0 /100 | #20 | Exceptional 98.6% |
| Lithuanians | 100.0 /100 | #21 | Exceptional 98.6% |
| Finns | 100.0 /100 | #22 | Exceptional 98.6% |
| Arapaho | 100.0 /100 | #23 | Exceptional 98.6% |
| Danes | 100.0 /100 | #24 | Exceptional 98.6% |
| Sioux | 100.0 /100 | #25 | Exceptional 98.6% |
| Poles | 100.0 /100 | #26 | Exceptional 98.6% |
| Scotch-Irish | 100.0 /100 | #27 | Exceptional 98.6% |
| Croatians | 100.0 /100 | #28 | Exceptional 98.6% |
| French | 100.0 /100 | #29 | Exceptional 98.6% |