Immigrants from Caribbean vs Moroccan 5th Grade
COMPARE
Immigrants from Caribbean
Moroccan
5th Grade
5th Grade Comparison
Immigrants from Caribbean
Moroccans
96.0%
5TH GRADE
0.0/ 100
METRIC RATING
307th/ 347
METRIC RANK
97.1%
5TH GRADE
12.0/ 100
METRIC RATING
205th/ 347
METRIC RANK
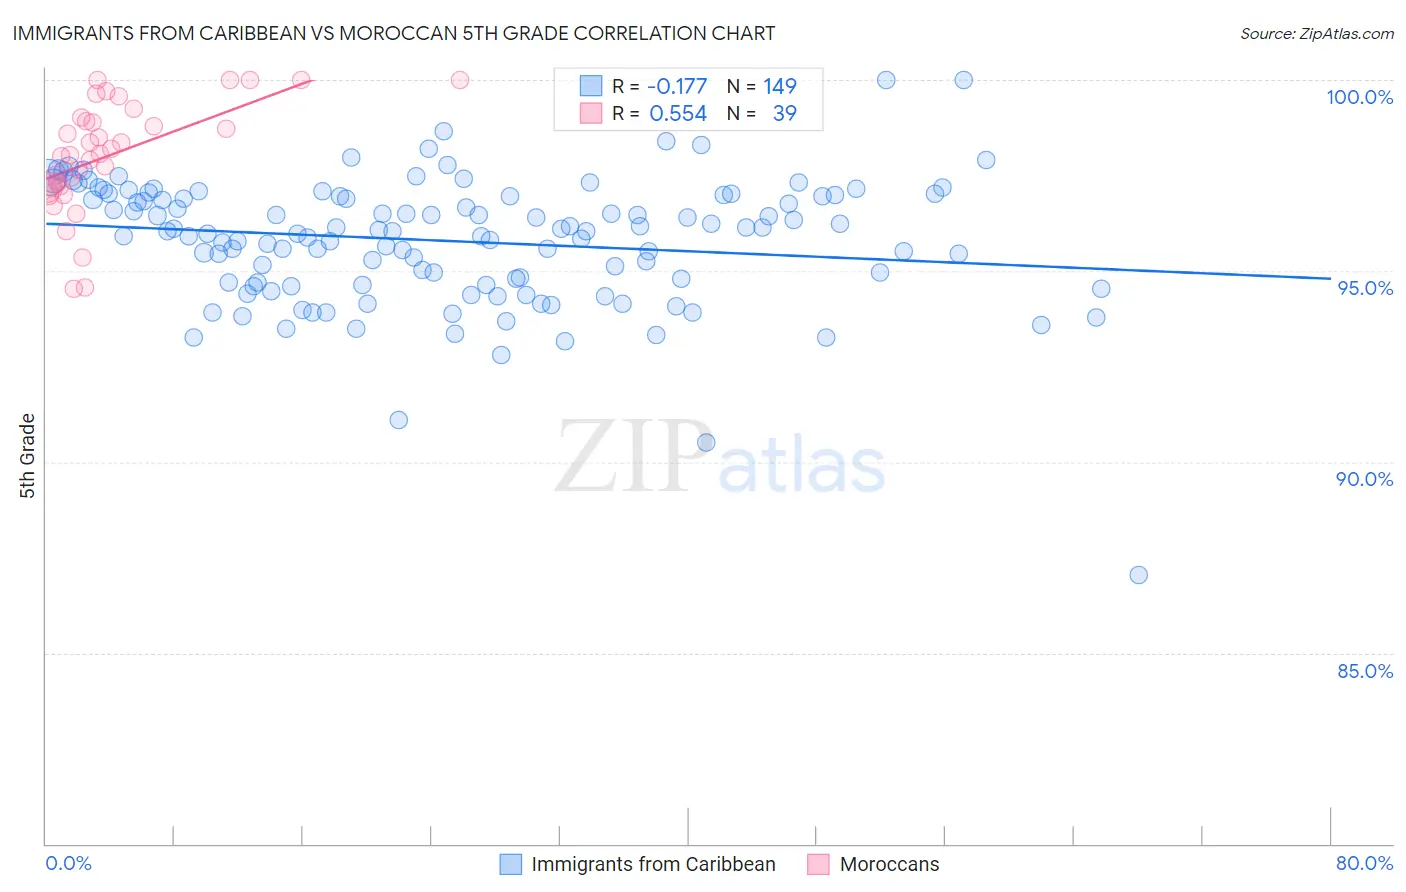
Immigrants from Caribbean vs Moroccan 5th Grade Correlation Chart
The statistical analysis conducted on geographies consisting of 450,065,262 people shows a poor negative correlation between the proportion of Immigrants from Caribbean and percentage of population with at least 5th grade education in the United States with a correlation coefficient (R) of -0.177 and weighted average of 96.0%. Similarly, the statistical analysis conducted on geographies consisting of 201,817,667 people shows a substantial positive correlation between the proportion of Moroccans and percentage of population with at least 5th grade education in the United States with a correlation coefficient (R) of 0.554 and weighted average of 97.1%, a difference of 1.1%.
5th Grade Correlation Summary
| Measurement | Immigrants from Caribbean | Moroccan |
| Minimum | 87.0% | 94.5% |
| Maximum | 100.0% | 100.0% |
| Range | 13.0% | 5.5% |
| Mean | 95.8% | 98.0% |
| Median | 96.0% | 98.1% |
| Interquartile 25% (IQ1) | 94.7% | 97.2% |
| Interquartile 75% (IQ3) | 97.0% | 99.0% |
| Interquartile Range (IQR) | 2.3% | 1.8% |
| Standard Deviation (Sample) | 1.7% | 1.4% |
| Standard Deviation (Population) | 1.7% | 1.4% |
Similar Demographics by 5th Grade
Demographics Similar to Immigrants from Caribbean by 5th Grade
In terms of 5th grade, the demographic groups most similar to Immigrants from Caribbean are Immigrants from Haiti (96.0%, a difference of 0.0%), Ecuadorian (96.0%, a difference of 0.010%), Immigrants from Laos (96.0%, a difference of 0.020%), Immigrants from Guyana (96.0%, a difference of 0.020%), and Immigrants from Burma/Myanmar (96.1%, a difference of 0.030%).
| Demographics | Rating | Rank | 5th Grade |
| Sri Lankans | 0.0 /100 | #300 | Tragic 96.1% |
| Immigrants | Cuba | 0.0 /100 | #301 | Tragic 96.1% |
| Guyanese | 0.0 /100 | #302 | Tragic 96.1% |
| Puerto Ricans | 0.0 /100 | #303 | Tragic 96.1% |
| Immigrants | Burma/Myanmar | 0.0 /100 | #304 | Tragic 96.1% |
| Immigrants | Laos | 0.0 /100 | #305 | Tragic 96.0% |
| Immigrants | Haiti | 0.0 /100 | #306 | Tragic 96.0% |
| Immigrants | Caribbean | 0.0 /100 | #307 | Tragic 96.0% |
| Ecuadorians | 0.0 /100 | #308 | Tragic 96.0% |
| Immigrants | Guyana | 0.0 /100 | #309 | Tragic 96.0% |
| Indonesians | 0.0 /100 | #310 | Tragic 96.0% |
| Immigrants | Bangladesh | 0.0 /100 | #311 | Tragic 96.0% |
| Vietnamese | 0.0 /100 | #312 | Tragic 95.9% |
| Bangladeshis | 0.0 /100 | #313 | Tragic 95.9% |
| Immigrants | Portugal | 0.0 /100 | #314 | Tragic 95.9% |
Demographics Similar to Moroccans by 5th Grade
In terms of 5th grade, the demographic groups most similar to Moroccans are Paiute (97.1%, a difference of 0.0%), Iraqi (97.1%, a difference of 0.010%), Laotian (97.1%, a difference of 0.010%), Immigrants from Zaire (97.1%, a difference of 0.020%), and Immigrants from Nepal (97.1%, a difference of 0.020%).
| Demographics | Rating | Rank | 5th Grade |
| Immigrants | Uganda | 21.1 /100 | #198 | Fair 97.2% |
| Natives/Alaskans | 18.0 /100 | #199 | Poor 97.2% |
| Immigrants | Northern Africa | 16.8 /100 | #200 | Poor 97.2% |
| Immigrants | Chile | 16.6 /100 | #201 | Poor 97.2% |
| Africans | 15.3 /100 | #202 | Poor 97.2% |
| Immigrants | Bahamas | 14.9 /100 | #203 | Poor 97.2% |
| Immigrants | Zaire | 13.7 /100 | #204 | Poor 97.1% |
| Moroccans | 12.0 /100 | #205 | Poor 97.1% |
| Paiute | 11.6 /100 | #206 | Poor 97.1% |
| Iraqis | 10.9 /100 | #207 | Poor 97.1% |
| Laotians | 10.8 /100 | #208 | Poor 97.1% |
| Immigrants | Nepal | 10.3 /100 | #209 | Poor 97.1% |
| Immigrants | Oceania | 10.0 /100 | #210 | Poor 97.1% |
| Samoans | 8.5 /100 | #211 | Tragic 97.1% |
| Immigrants | Iraq | 8.3 /100 | #212 | Tragic 97.1% |