Immigrants from Cambodia vs Immigrants from Germany No Schooling Completed
COMPARE
Immigrants from Cambodia
Immigrants from Germany
No Schooling Completed
No Schooling Completed Comparison
Immigrants from Cambodia
Immigrants from Germany
3.5%
NO SCHOOLING COMPLETED
0.0/ 100
METRIC RATING
335th/ 347
METRIC RANK
1.8%
NO SCHOOLING COMPLETED
99.0/ 100
METRIC RATING
91st/ 347
METRIC RANK
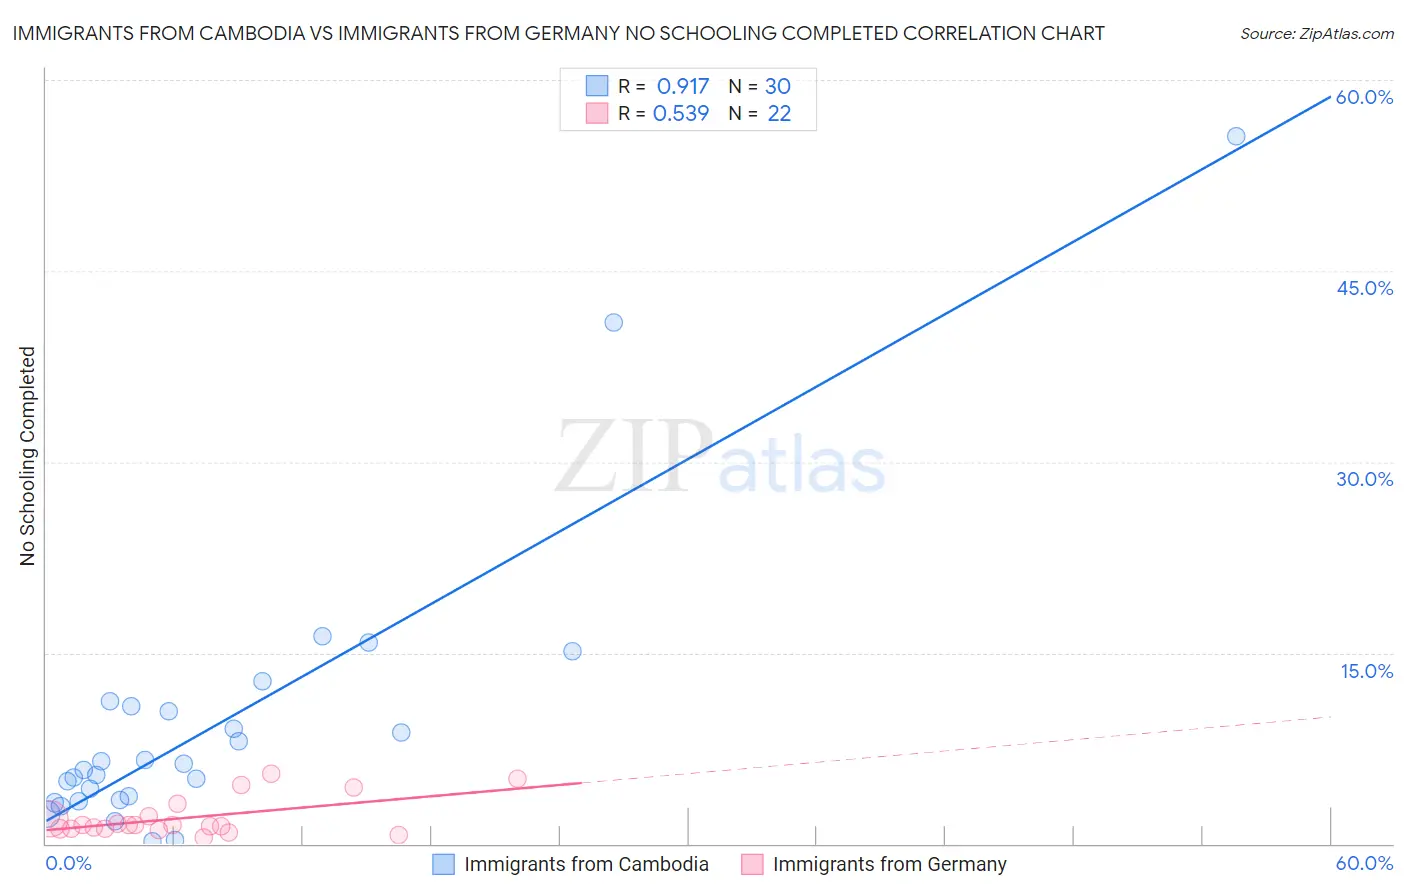
Immigrants from Cambodia vs Immigrants from Germany No Schooling Completed Correlation Chart
The statistical analysis conducted on geographies consisting of 204,723,315 people shows a near-perfect positive correlation between the proportion of Immigrants from Cambodia and percentage of population with no schooling in the United States with a correlation coefficient (R) of 0.917 and weighted average of 3.5%. Similarly, the statistical analysis conducted on geographies consisting of 457,031,521 people shows a substantial positive correlation between the proportion of Immigrants from Germany and percentage of population with no schooling in the United States with a correlation coefficient (R) of 0.539 and weighted average of 1.8%, a difference of 97.3%.
No Schooling Completed Correlation Summary
| Measurement | Immigrants from Cambodia | Immigrants from Germany |
| Minimum | 0.15% | 0.48% |
| Maximum | 55.6% | 5.5% |
| Range | 55.4% | 5.1% |
| Mean | 9.5% | 2.0% |
| Median | 6.0% | 1.5% |
| Interquartile 25% (IQ1) | 3.4% | 1.2% |
| Interquartile 75% (IQ3) | 10.8% | 2.2% |
| Interquartile Range (IQR) | 7.4% | 1.0% |
| Standard Deviation (Sample) | 11.5% | 1.5% |
| Standard Deviation (Population) | 11.4% | 1.5% |
Similar Demographics by No Schooling Completed
Demographics Similar to Immigrants from Cambodia by No Schooling Completed
In terms of no schooling completed, the demographic groups most similar to Immigrants from Cambodia are Immigrants from Fiji (3.5%, a difference of 0.37%), Guatemalan (3.5%, a difference of 1.0%), Immigrants from Cabo Verde (3.5%, a difference of 1.1%), Bangladeshi (3.5%, a difference of 1.3%), and Yakama (3.6%, a difference of 1.6%).
| Demographics | Rating | Rank | No Schooling Completed |
| Mexicans | 0.0 /100 | #328 | Tragic 3.3% |
| Immigrants | Vietnam | 0.0 /100 | #329 | Tragic 3.3% |
| Immigrants | Armenia | 0.0 /100 | #330 | Tragic 3.3% |
| Japanese | 0.0 /100 | #331 | Tragic 3.3% |
| Central Americans | 0.0 /100 | #332 | Tragic 3.4% |
| Immigrants | Dominican Republic | 0.0 /100 | #333 | Tragic 3.4% |
| Guatemalans | 0.0 /100 | #334 | Tragic 3.5% |
| Immigrants | Cambodia | 0.0 /100 | #335 | Tragic 3.5% |
| Immigrants | Fiji | 0.0 /100 | #336 | Tragic 3.5% |
| Immigrants | Cabo Verde | 0.0 /100 | #337 | Tragic 3.5% |
| Bangladeshis | 0.0 /100 | #338 | Tragic 3.5% |
| Yakama | 0.0 /100 | #339 | Tragic 3.6% |
| Immigrants | Guatemala | 0.0 /100 | #340 | Tragic 3.6% |
| Immigrants | Central America | 0.0 /100 | #341 | Tragic 3.6% |
| Immigrants | Mexico | 0.0 /100 | #342 | Tragic 3.6% |
Demographics Similar to Immigrants from Germany by No Schooling Completed
In terms of no schooling completed, the demographic groups most similar to Immigrants from Germany are Sioux (1.8%, a difference of 0.11%), Romanian (1.8%, a difference of 0.52%), South African (1.8%, a difference of 0.82%), Immigrants from Western Europe (1.8%, a difference of 0.86%), and Turkish (1.8%, a difference of 0.89%).
| Demographics | Rating | Rank | No Schooling Completed |
| Immigrants | Denmark | 99.2 /100 | #84 | Exceptional 1.7% |
| Immigrants | Australia | 99.2 /100 | #85 | Exceptional 1.7% |
| Ukrainians | 99.2 /100 | #86 | Exceptional 1.8% |
| Osage | 99.2 /100 | #87 | Exceptional 1.8% |
| Immigrants | Western Europe | 99.2 /100 | #88 | Exceptional 1.8% |
| South Africans | 99.1 /100 | #89 | Exceptional 1.8% |
| Sioux | 99.0 /100 | #90 | Exceptional 1.8% |
| Immigrants | Germany | 99.0 /100 | #91 | Exceptional 1.8% |
| Romanians | 98.8 /100 | #92 | Exceptional 1.8% |
| Turks | 98.7 /100 | #93 | Exceptional 1.8% |
| Immigrants | Nonimmigrants | 98.5 /100 | #94 | Exceptional 1.8% |
| Puget Sound Salish | 98.5 /100 | #95 | Exceptional 1.8% |
| Bhutanese | 98.4 /100 | #96 | Exceptional 1.8% |
| Immigrants | Ireland | 98.4 /100 | #97 | Exceptional 1.8% |
| Iranians | 98.2 /100 | #98 | Exceptional 1.8% |