Immigrants from Cambodia vs Immigrants from Albania In Labor Force | Age 45-54
COMPARE
Immigrants from Cambodia
Immigrants from Albania
In Labor Force | Age 45-54
In Labor Force | Age 45-54 Comparison
Immigrants from Cambodia
Immigrants from Albania
81.9%
IN LABOR FORCE | AGE 45-54
0.8/ 100
METRIC RATING
241st/ 347
METRIC RANK
83.2%
IN LABOR FORCE | AGE 45-54
91.8/ 100
METRIC RATING
113th/ 347
METRIC RANK
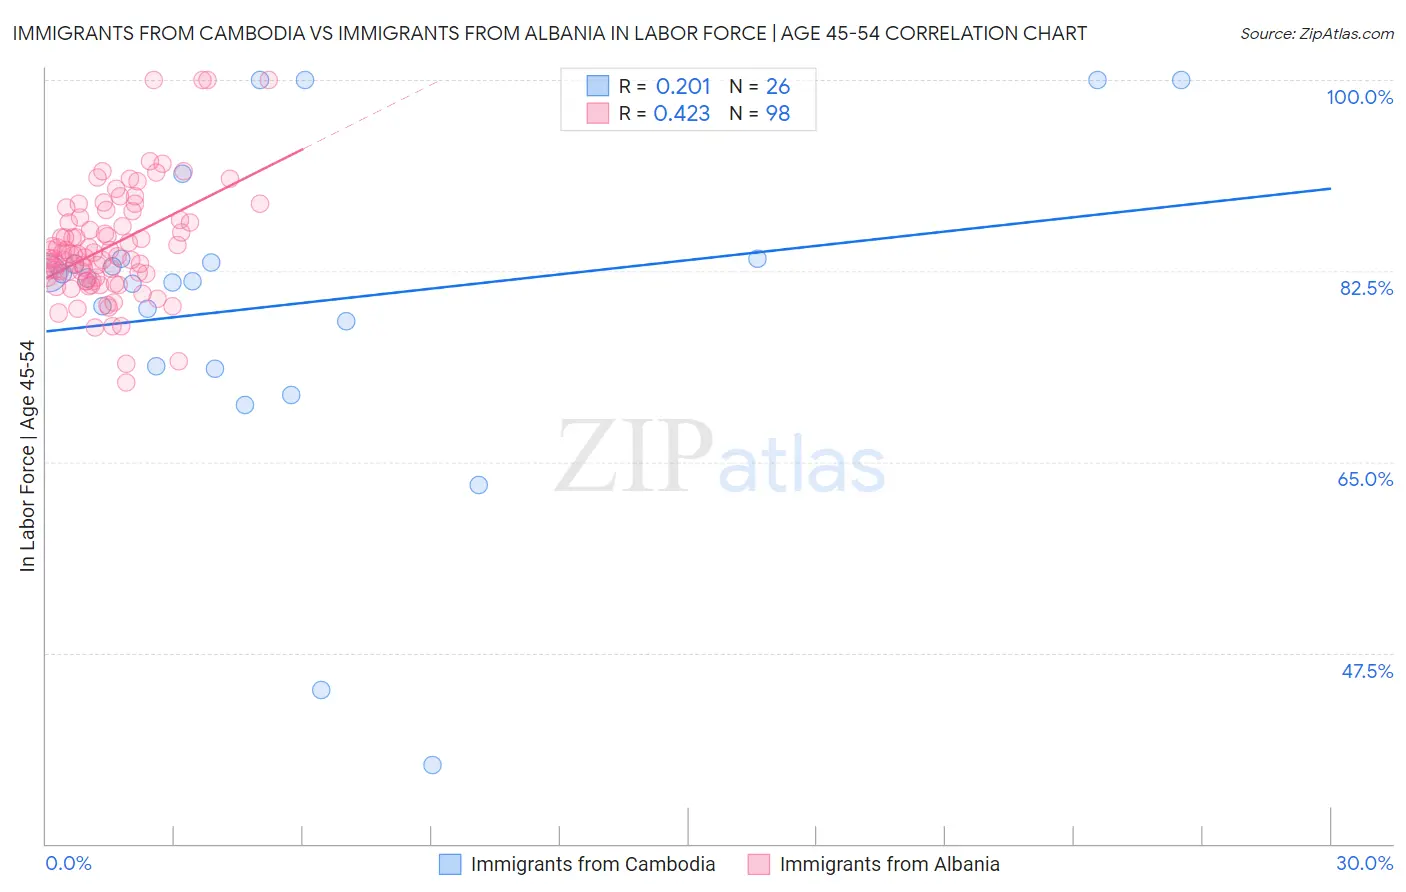
Immigrants from Cambodia vs Immigrants from Albania In Labor Force | Age 45-54 Correlation Chart
The statistical analysis conducted on geographies consisting of 205,128,905 people shows a weak positive correlation between the proportion of Immigrants from Cambodia and labor force participation rate among population between the ages 45 and 54 in the United States with a correlation coefficient (R) of 0.201 and weighted average of 81.9%. Similarly, the statistical analysis conducted on geographies consisting of 119,388,252 people shows a moderate positive correlation between the proportion of Immigrants from Albania and labor force participation rate among population between the ages 45 and 54 in the United States with a correlation coefficient (R) of 0.423 and weighted average of 83.2%, a difference of 1.6%.
In Labor Force | Age 45-54 Correlation Summary
| Measurement | Immigrants from Cambodia | Immigrants from Albania |
| Minimum | 37.2% | 72.3% |
| Maximum | 100.0% | 100.0% |
| Range | 62.8% | 27.7% |
| Mean | 79.5% | 84.8% |
| Median | 81.7% | 84.0% |
| Interquartile 25% (IQ1) | 73.8% | 81.8% |
| Interquartile 75% (IQ3) | 83.6% | 87.2% |
| Interquartile Range (IQR) | 9.8% | 5.4% |
| Standard Deviation (Sample) | 14.8% | 5.1% |
| Standard Deviation (Population) | 14.5% | 5.1% |
Similar Demographics by In Labor Force | Age 45-54
Demographics Similar to Immigrants from Cambodia by In Labor Force | Age 45-54
In terms of in labor force | age 45-54, the demographic groups most similar to Immigrants from Cambodia are White/Caucasian (81.9%, a difference of 0.040%), Immigrants from El Salvador (81.9%, a difference of 0.050%), Samoan (81.8%, a difference of 0.050%), Immigrants from Thailand (81.9%, a difference of 0.060%), and Trinidadian and Tobagonian (81.9%, a difference of 0.080%).
| Demographics | Rating | Rank | In Labor Force | Age 45-54 |
| Salvadorans | 1.7 /100 | #234 | Tragic 82.0% |
| Sub-Saharan Africans | 1.2 /100 | #235 | Tragic 82.0% |
| Basques | 1.2 /100 | #236 | Tragic 82.0% |
| Immigrants | Trinidad and Tobago | 1.2 /100 | #237 | Tragic 82.0% |
| Trinidadians and Tobagonians | 1.1 /100 | #238 | Tragic 81.9% |
| Immigrants | Thailand | 1.0 /100 | #239 | Tragic 81.9% |
| Immigrants | El Salvador | 1.0 /100 | #240 | Tragic 81.9% |
| Immigrants | Cambodia | 0.8 /100 | #241 | Tragic 81.9% |
| Whites/Caucasians | 0.7 /100 | #242 | Tragic 81.9% |
| Samoans | 0.6 /100 | #243 | Tragic 81.8% |
| Celtics | 0.4 /100 | #244 | Tragic 81.8% |
| Alaska Natives | 0.4 /100 | #245 | Tragic 81.8% |
| Alaskan Athabascans | 0.4 /100 | #246 | Tragic 81.8% |
| Central Americans | 0.4 /100 | #247 | Tragic 81.7% |
| Puget Sound Salish | 0.3 /100 | #248 | Tragic 81.7% |
Demographics Similar to Immigrants from Albania by In Labor Force | Age 45-54
In terms of in labor force | age 45-54, the demographic groups most similar to Immigrants from Albania are Assyrian/Chaldean/Syriac (83.2%, a difference of 0.0%), Immigrants from Chile (83.2%, a difference of 0.010%), Immigrants from Malaysia (83.2%, a difference of 0.010%), Immigrants from Italy (83.2%, a difference of 0.020%), and Immigrants from Afghanistan (83.2%, a difference of 0.020%).
| Demographics | Rating | Rank | In Labor Force | Age 45-54 |
| Sri Lankans | 93.2 /100 | #106 | Exceptional 83.2% |
| Iranians | 92.9 /100 | #107 | Exceptional 83.2% |
| Slovaks | 92.8 /100 | #108 | Exceptional 83.2% |
| Ukrainians | 92.7 /100 | #109 | Exceptional 83.2% |
| Immigrants | Africa | 92.6 /100 | #110 | Exceptional 83.2% |
| Immigrants | Italy | 92.5 /100 | #111 | Exceptional 83.2% |
| Immigrants | Afghanistan | 92.4 /100 | #112 | Exceptional 83.2% |
| Immigrants | Albania | 91.8 /100 | #113 | Exceptional 83.2% |
| Assyrians/Chaldeans/Syriacs | 91.7 /100 | #114 | Exceptional 83.2% |
| Immigrants | Chile | 91.6 /100 | #115 | Exceptional 83.2% |
| Immigrants | Malaysia | 91.4 /100 | #116 | Exceptional 83.2% |
| Immigrants | China | 90.9 /100 | #117 | Exceptional 83.2% |
| Immigrants | Europe | 90.7 /100 | #118 | Exceptional 83.2% |
| Immigrants | Uruguay | 90.2 /100 | #119 | Exceptional 83.2% |
| Immigrants | Russia | 90.1 /100 | #120 | Exceptional 83.2% |