Immigrants from Bolivia vs Immigrants from Albania Associate's Degree
COMPARE
Immigrants from Bolivia
Immigrants from Albania
Associate's Degree
Associate's Degree Comparison
Immigrants from Bolivia
Immigrants from Albania
51.5%
ASSOCIATE'S DEGREE
99.7/ 100
METRIC RATING
60th/ 347
METRIC RANK
48.2%
ASSOCIATE'S DEGREE
89.9/ 100
METRIC RATING
132nd/ 347
METRIC RANK
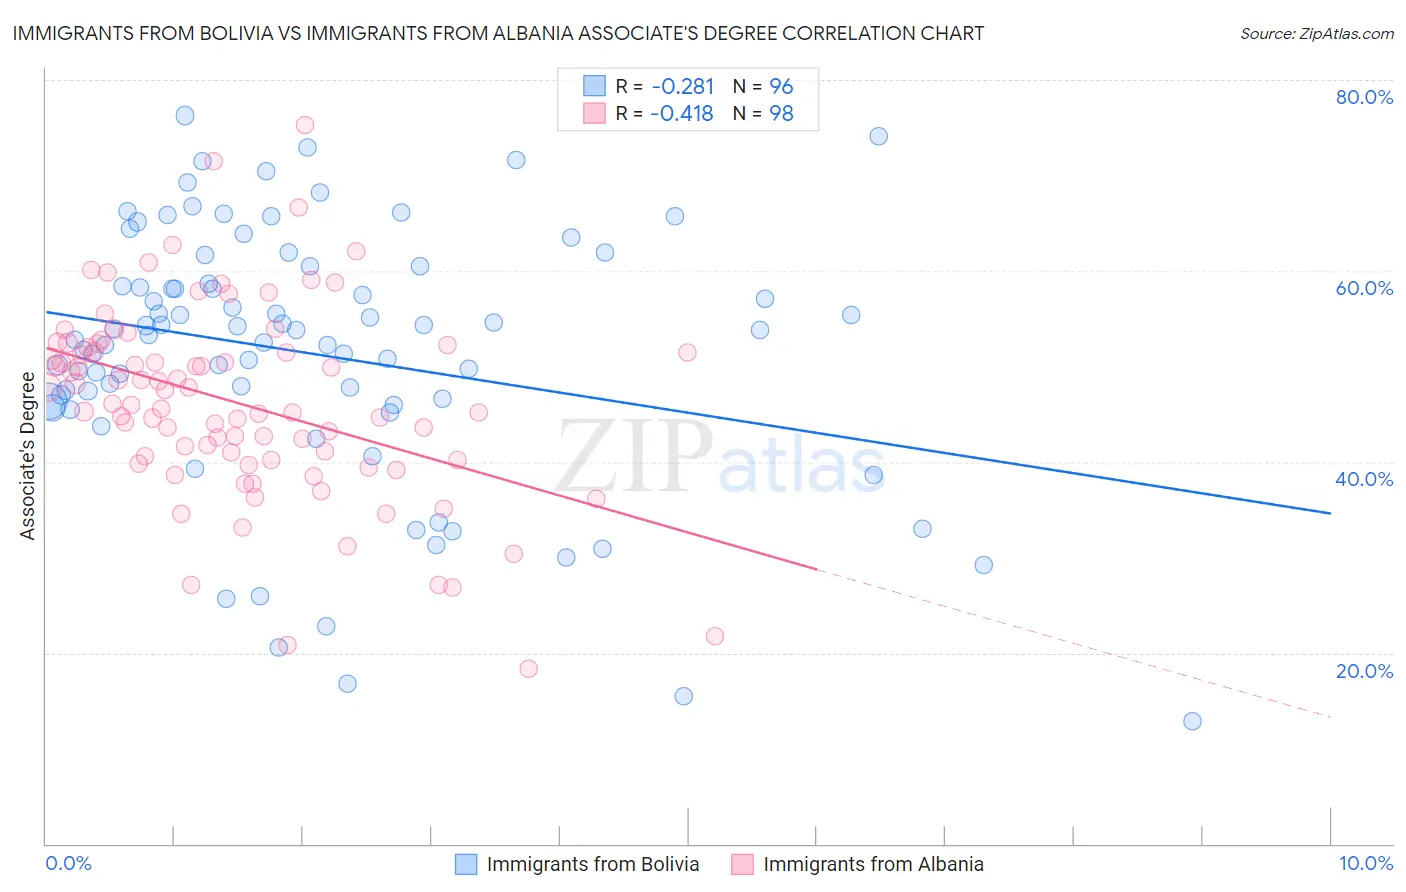
Immigrants from Bolivia vs Immigrants from Albania Associate's Degree Correlation Chart
The statistical analysis conducted on geographies consisting of 158,730,512 people shows a weak negative correlation between the proportion of Immigrants from Bolivia and percentage of population with at least associate's degree education in the United States with a correlation coefficient (R) of -0.281 and weighted average of 51.5%. Similarly, the statistical analysis conducted on geographies consisting of 119,391,185 people shows a moderate negative correlation between the proportion of Immigrants from Albania and percentage of population with at least associate's degree education in the United States with a correlation coefficient (R) of -0.418 and weighted average of 48.2%, a difference of 6.8%.
Associate's Degree Correlation Summary
| Measurement | Immigrants from Bolivia | Immigrants from Albania |
| Minimum | 12.9% | 18.3% |
| Maximum | 76.3% | 75.3% |
| Range | 63.4% | 57.0% |
| Mean | 51.2% | 46.2% |
| Median | 53.5% | 46.0% |
| Interquartile 25% (IQ1) | 46.1% | 40.3% |
| Interquartile 75% (IQ3) | 59.5% | 52.0% |
| Interquartile Range (IQR) | 13.4% | 11.7% |
| Standard Deviation (Sample) | 13.6% | 10.1% |
| Standard Deviation (Population) | 13.6% | 10.1% |
Similar Demographics by Associate's Degree
Demographics Similar to Immigrants from Bolivia by Associate's Degree
In terms of associate's degree, the demographic groups most similar to Immigrants from Bolivia are Immigrants from Kazakhstan (51.4%, a difference of 0.15%), Bhutanese (51.4%, a difference of 0.15%), South African (51.4%, a difference of 0.21%), Immigrants from Netherlands (51.4%, a difference of 0.28%), and Zimbabwean (51.3%, a difference of 0.31%).
| Demographics | Rating | Rank | Associate's Degree |
| Immigrants | Asia | 99.8 /100 | #53 | Exceptional 52.0% |
| Immigrants | Spain | 99.8 /100 | #54 | Exceptional 51.9% |
| Australians | 99.8 /100 | #55 | Exceptional 51.9% |
| Immigrants | Czechoslovakia | 99.8 /100 | #56 | Exceptional 51.9% |
| Paraguayans | 99.8 /100 | #57 | Exceptional 51.8% |
| New Zealanders | 99.8 /100 | #58 | Exceptional 51.8% |
| Immigrants | Serbia | 99.8 /100 | #59 | Exceptional 51.7% |
| Immigrants | Bolivia | 99.7 /100 | #60 | Exceptional 51.5% |
| Immigrants | Kazakhstan | 99.7 /100 | #61 | Exceptional 51.4% |
| Bhutanese | 99.7 /100 | #62 | Exceptional 51.4% |
| South Africans | 99.7 /100 | #63 | Exceptional 51.4% |
| Immigrants | Netherlands | 99.7 /100 | #64 | Exceptional 51.4% |
| Zimbabweans | 99.7 /100 | #65 | Exceptional 51.3% |
| Immigrants | Europe | 99.7 /100 | #66 | Exceptional 51.3% |
| Argentineans | 99.6 /100 | #67 | Exceptional 51.2% |
Demographics Similar to Immigrants from Albania by Associate's Degree
In terms of associate's degree, the demographic groups most similar to Immigrants from Albania are Assyrian/Chaldean/Syriac (48.2%, a difference of 0.080%), Moroccan (48.2%, a difference of 0.10%), European (48.2%, a difference of 0.16%), Icelander (48.3%, a difference of 0.18%), and Immigrants from Jordan (48.4%, a difference of 0.29%).
| Demographics | Rating | Rank | Associate's Degree |
| Chinese | 92.5 /100 | #125 | Exceptional 48.5% |
| Immigrants | Syria | 92.2 /100 | #126 | Exceptional 48.5% |
| Immigrants | Uganda | 92.1 /100 | #127 | Exceptional 48.5% |
| Immigrants | Eastern Africa | 91.6 /100 | #128 | Exceptional 48.4% |
| Swedes | 91.5 /100 | #129 | Exceptional 48.4% |
| Immigrants | Jordan | 91.2 /100 | #130 | Exceptional 48.4% |
| Icelanders | 90.8 /100 | #131 | Exceptional 48.3% |
| Immigrants | Albania | 89.9 /100 | #132 | Excellent 48.2% |
| Assyrians/Chaldeans/Syriacs | 89.4 /100 | #133 | Excellent 48.2% |
| Moroccans | 89.3 /100 | #134 | Excellent 48.2% |
| Europeans | 89.0 /100 | #135 | Excellent 48.2% |
| Pakistanis | 88.0 /100 | #136 | Excellent 48.1% |
| Immigrants | Eritrea | 87.8 /100 | #137 | Excellent 48.1% |
| Poles | 87.3 /100 | #138 | Excellent 48.0% |
| Slovenes | 85.1 /100 | #139 | Excellent 47.9% |