Immigrants from Cabo Verde vs Basque 7th Grade
COMPARE
Immigrants from Cabo Verde
Basque
7th Grade
7th Grade Comparison
Immigrants from Cabo Verde
Basques
93.1%
7TH GRADE
0.0/ 100
METRIC RATING
327th/ 347
METRIC RANK
96.4%
7TH GRADE
89.3/ 100
METRIC RATING
139th/ 347
METRIC RANK
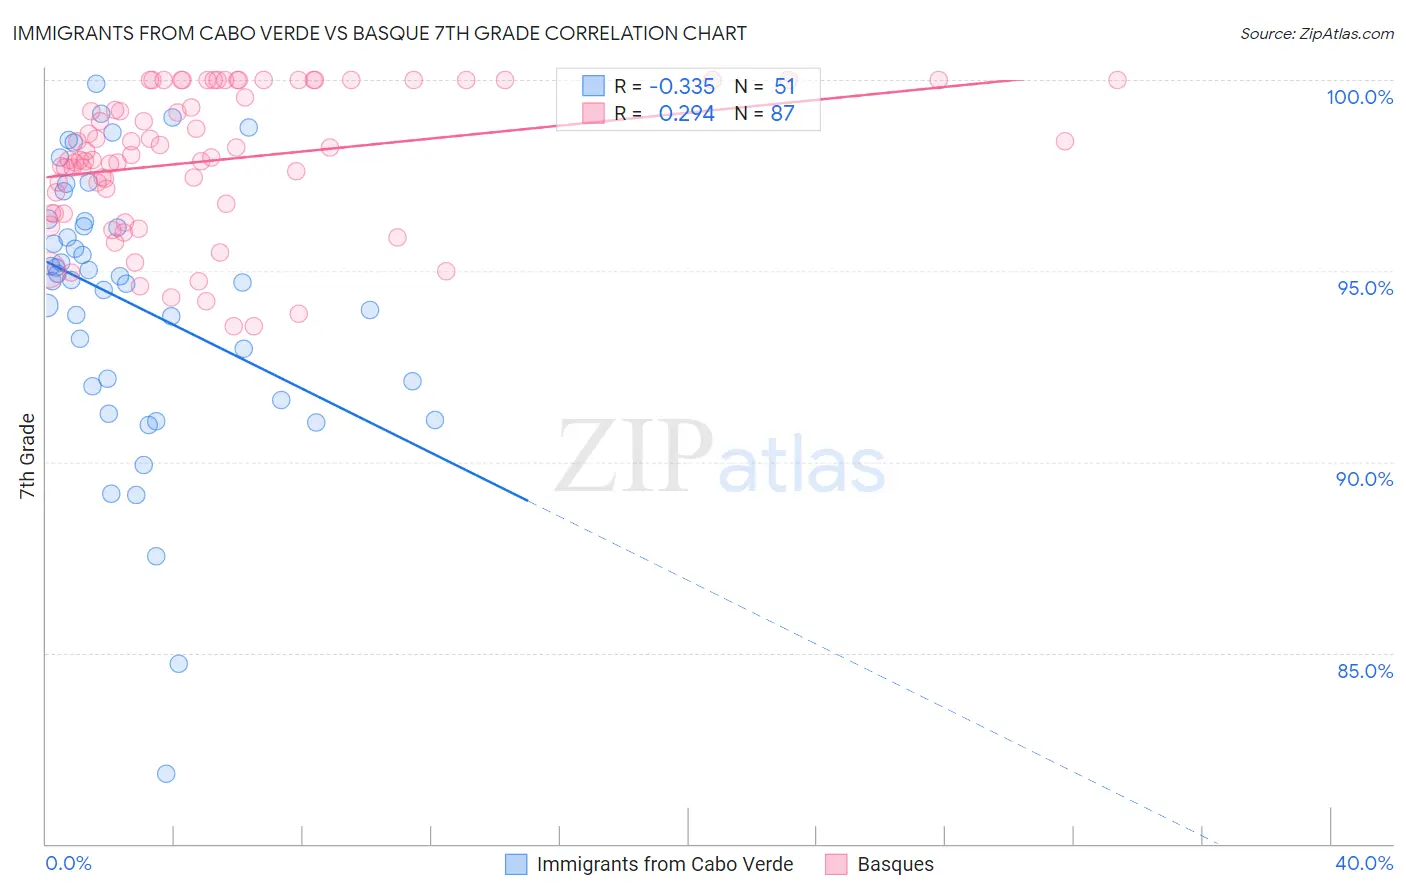
Immigrants from Cabo Verde vs Basque 7th Grade Correlation Chart
The statistical analysis conducted on geographies consisting of 38,158,316 people shows a mild negative correlation between the proportion of Immigrants from Cabo Verde and percentage of population with at least 7th grade education in the United States with a correlation coefficient (R) of -0.335 and weighted average of 93.1%. Similarly, the statistical analysis conducted on geographies consisting of 165,777,136 people shows a weak positive correlation between the proportion of Basques and percentage of population with at least 7th grade education in the United States with a correlation coefficient (R) of 0.294 and weighted average of 96.4%, a difference of 3.5%.
7th Grade Correlation Summary
| Measurement | Immigrants from Cabo Verde | Basque |
| Minimum | 81.8% | 93.5% |
| Maximum | 99.9% | 100.0% |
| Range | 18.1% | 6.5% |
| Mean | 94.1% | 97.9% |
| Median | 94.8% | 98.0% |
| Interquartile 25% (IQ1) | 92.0% | 96.5% |
| Interquartile 75% (IQ3) | 96.3% | 100.0% |
| Interquartile Range (IQR) | 4.3% | 3.5% |
| Standard Deviation (Sample) | 3.6% | 1.8% |
| Standard Deviation (Population) | 3.6% | 1.8% |
Similar Demographics by 7th Grade
Demographics Similar to Immigrants from Cabo Verde by 7th Grade
In terms of 7th grade, the demographic groups most similar to Immigrants from Cabo Verde are Nepalese (93.2%, a difference of 0.070%), Immigrants from Nicaragua (93.0%, a difference of 0.13%), Immigrants from the Azores (93.0%, a difference of 0.17%), Central American Indian (93.3%, a difference of 0.18%), and Immigrants from Dominican Republic (92.9%, a difference of 0.22%).
| Demographics | Rating | Rank | 7th Grade |
| Immigrants | Fiji | 0.0 /100 | #320 | Tragic 93.5% |
| Belizeans | 0.0 /100 | #321 | Tragic 93.5% |
| Nicaraguans | 0.0 /100 | #322 | Tragic 93.5% |
| Immigrants | Belize | 0.0 /100 | #323 | Tragic 93.4% |
| Dominicans | 0.0 /100 | #324 | Tragic 93.3% |
| Central American Indians | 0.0 /100 | #325 | Tragic 93.3% |
| Nepalese | 0.0 /100 | #326 | Tragic 93.2% |
| Immigrants | Cabo Verde | 0.0 /100 | #327 | Tragic 93.1% |
| Immigrants | Nicaragua | 0.0 /100 | #328 | Tragic 93.0% |
| Immigrants | Azores | 0.0 /100 | #329 | Tragic 93.0% |
| Immigrants | Dominican Republic | 0.0 /100 | #330 | Tragic 92.9% |
| Hondurans | 0.0 /100 | #331 | Tragic 92.9% |
| Hispanics or Latinos | 0.0 /100 | #332 | Tragic 92.7% |
| Immigrants | Armenia | 0.0 /100 | #333 | Tragic 92.7% |
| Immigrants | Yemen | 0.0 /100 | #334 | Tragic 92.6% |
Demographics Similar to Basques by 7th Grade
In terms of 7th grade, the demographic groups most similar to Basques are Jordanian (96.4%, a difference of 0.010%), Immigrants from Hungary (96.4%, a difference of 0.020%), Immigrants from Turkey (96.4%, a difference of 0.020%), Cambodian (96.3%, a difference of 0.020%), and Soviet Union (96.4%, a difference of 0.030%).
| Demographics | Rating | Rank | 7th Grade |
| Colville | 91.7 /100 | #132 | Exceptional 96.4% |
| Hmong | 91.5 /100 | #133 | Exceptional 96.4% |
| Soviet Union | 91.2 /100 | #134 | Exceptional 96.4% |
| Immigrants | Kuwait | 91.1 /100 | #135 | Exceptional 96.4% |
| Immigrants | Hungary | 90.6 /100 | #136 | Exceptional 96.4% |
| Immigrants | Turkey | 90.2 /100 | #137 | Exceptional 96.4% |
| Jordanians | 90.0 /100 | #138 | Excellent 96.4% |
| Basques | 89.3 /100 | #139 | Excellent 96.4% |
| Cambodians | 88.3 /100 | #140 | Excellent 96.3% |
| Immigrants | South Central Asia | 87.1 /100 | #141 | Excellent 96.3% |
| Burmese | 87.1 /100 | #142 | Excellent 96.3% |
| Spanish | 86.6 /100 | #143 | Excellent 96.3% |
| Immigrants | Greece | 85.9 /100 | #144 | Excellent 96.3% |
| Blackfeet | 83.9 /100 | #145 | Excellent 96.3% |
| Immigrants | Eastern Europe | 83.7 /100 | #146 | Excellent 96.3% |