Immigrants from Cabo Verde vs Nonimmigrants 7th Grade
COMPARE
Immigrants from Cabo Verde
Nonimmigrants
7th Grade
7th Grade Comparison
Immigrants from Cabo Verde
Nonimmigrants
93.1%
7TH GRADE
0.0/ 100
METRIC RATING
327th/ 347
METRIC RANK
96.5%
7TH GRADE
97.0/ 100
METRIC RATING
112th/ 347
METRIC RANK
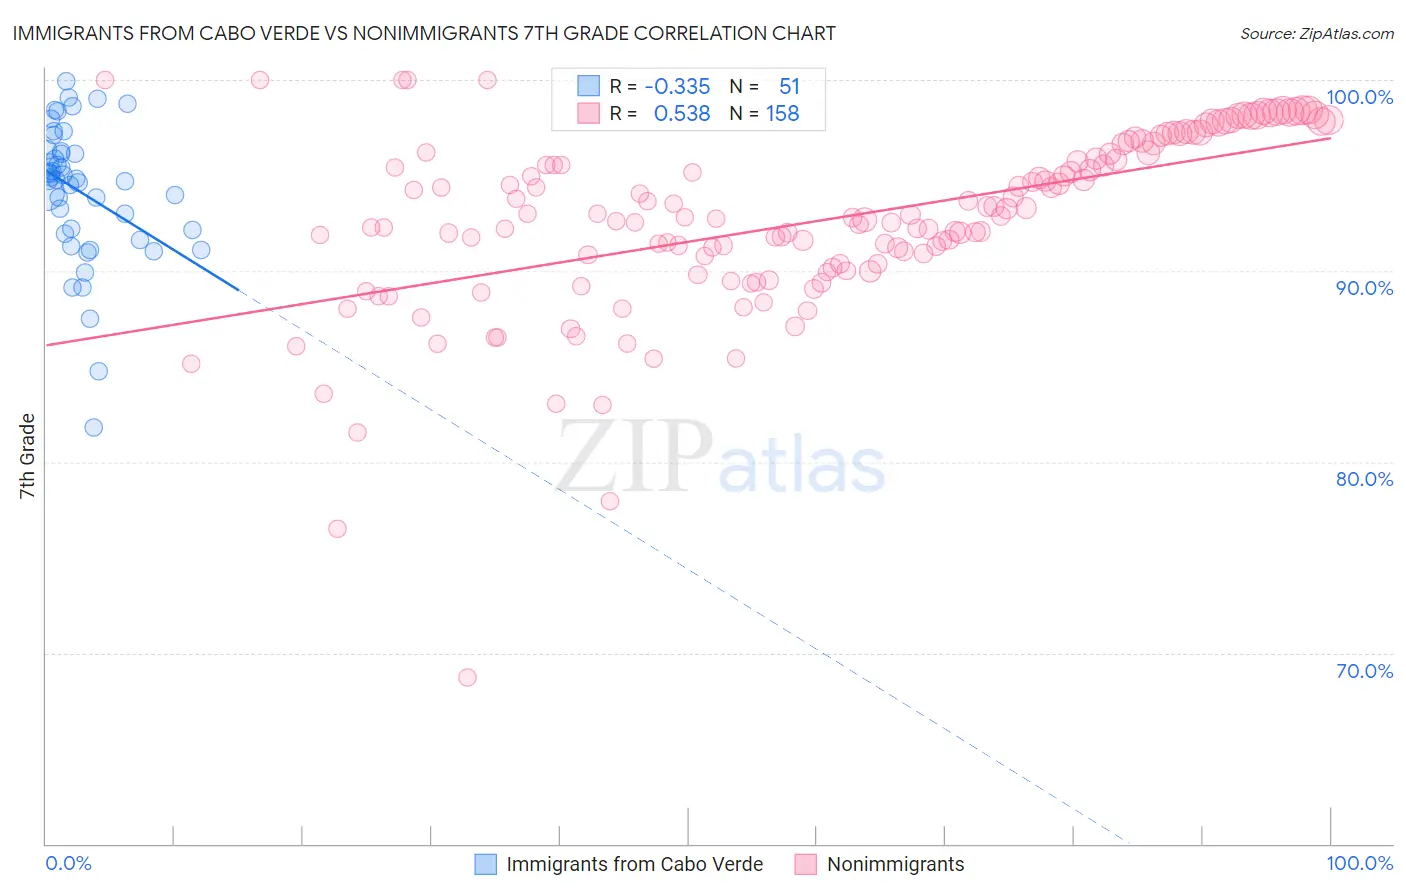
Immigrants from Cabo Verde vs Nonimmigrants 7th Grade Correlation Chart
The statistical analysis conducted on geographies consisting of 38,158,316 people shows a mild negative correlation between the proportion of Immigrants from Cabo Verde and percentage of population with at least 7th grade education in the United States with a correlation coefficient (R) of -0.335 and weighted average of 93.1%. Similarly, the statistical analysis conducted on geographies consisting of 585,374,406 people shows a substantial positive correlation between the proportion of Nonimmigrants and percentage of population with at least 7th grade education in the United States with a correlation coefficient (R) of 0.538 and weighted average of 96.5%, a difference of 3.7%.
7th Grade Correlation Summary
| Measurement | Immigrants from Cabo Verde | Nonimmigrants |
| Minimum | 81.8% | 68.7% |
| Maximum | 99.9% | 100.0% |
| Range | 18.1% | 31.3% |
| Mean | 94.1% | 92.6% |
| Median | 94.8% | 92.8% |
| Interquartile 25% (IQ1) | 92.0% | 90.2% |
| Interquartile 75% (IQ3) | 96.3% | 96.1% |
| Interquartile Range (IQR) | 4.3% | 5.9% |
| Standard Deviation (Sample) | 3.6% | 4.7% |
| Standard Deviation (Population) | 3.6% | 4.7% |
Similar Demographics by 7th Grade
Demographics Similar to Immigrants from Cabo Verde by 7th Grade
In terms of 7th grade, the demographic groups most similar to Immigrants from Cabo Verde are Nepalese (93.2%, a difference of 0.070%), Immigrants from Nicaragua (93.0%, a difference of 0.13%), Immigrants from the Azores (93.0%, a difference of 0.17%), Central American Indian (93.3%, a difference of 0.18%), and Immigrants from Dominican Republic (92.9%, a difference of 0.22%).
| Demographics | Rating | Rank | 7th Grade |
| Immigrants | Fiji | 0.0 /100 | #320 | Tragic 93.5% |
| Belizeans | 0.0 /100 | #321 | Tragic 93.5% |
| Nicaraguans | 0.0 /100 | #322 | Tragic 93.5% |
| Immigrants | Belize | 0.0 /100 | #323 | Tragic 93.4% |
| Dominicans | 0.0 /100 | #324 | Tragic 93.3% |
| Central American Indians | 0.0 /100 | #325 | Tragic 93.3% |
| Nepalese | 0.0 /100 | #326 | Tragic 93.2% |
| Immigrants | Cabo Verde | 0.0 /100 | #327 | Tragic 93.1% |
| Immigrants | Nicaragua | 0.0 /100 | #328 | Tragic 93.0% |
| Immigrants | Azores | 0.0 /100 | #329 | Tragic 93.0% |
| Immigrants | Dominican Republic | 0.0 /100 | #330 | Tragic 92.9% |
| Hondurans | 0.0 /100 | #331 | Tragic 92.9% |
| Hispanics or Latinos | 0.0 /100 | #332 | Tragic 92.7% |
| Immigrants | Armenia | 0.0 /100 | #333 | Tragic 92.7% |
| Immigrants | Yemen | 0.0 /100 | #334 | Tragic 92.6% |
Demographics Similar to Nonimmigrants by 7th Grade
In terms of 7th grade, the demographic groups most similar to Nonimmigrants are Pueblo (96.5%, a difference of 0.010%), Okinawan (96.6%, a difference of 0.020%), Immigrants from Latvia (96.6%, a difference of 0.020%), Immigrants from Zimbabwe (96.5%, a difference of 0.020%), and Choctaw (96.5%, a difference of 0.020%).
| Demographics | Rating | Rank | 7th Grade |
| South Africans | 98.0 /100 | #105 | Exceptional 96.6% |
| Iroquois | 97.9 /100 | #106 | Exceptional 96.6% |
| Lumbee | 97.8 /100 | #107 | Exceptional 96.6% |
| Immigrants | Saudi Arabia | 97.8 /100 | #108 | Exceptional 96.6% |
| Bhutanese | 97.7 /100 | #109 | Exceptional 96.6% |
| Okinawans | 97.4 /100 | #110 | Exceptional 96.6% |
| Immigrants | Latvia | 97.4 /100 | #111 | Exceptional 96.6% |
| Immigrants | Nonimmigrants | 97.0 /100 | #112 | Exceptional 96.5% |
| Pueblo | 96.8 /100 | #113 | Exceptional 96.5% |
| Immigrants | Zimbabwe | 96.6 /100 | #114 | Exceptional 96.5% |
| Choctaw | 96.6 /100 | #115 | Exceptional 96.5% |
| Syrians | 96.6 /100 | #116 | Exceptional 96.5% |
| Immigrants | Moldova | 95.7 /100 | #117 | Exceptional 96.5% |
| Immigrants | Japan | 95.5 /100 | #118 | Exceptional 96.5% |
| Immigrants | Norway | 95.2 /100 | #119 | Exceptional 96.5% |