Immigrants from Burma/Myanmar vs Hawaiian Doctorate Degree
COMPARE
Immigrants from Burma/Myanmar
Hawaiian
Doctorate Degree
Doctorate Degree Comparison
Immigrants from Burma/Myanmar
Hawaiians
1.7%
DOCTORATE DEGREE
13.5/ 100
METRIC RATING
216th/ 347
METRIC RANK
1.5%
DOCTORATE DEGREE
0.4/ 100
METRIC RATING
278th/ 347
METRIC RANK
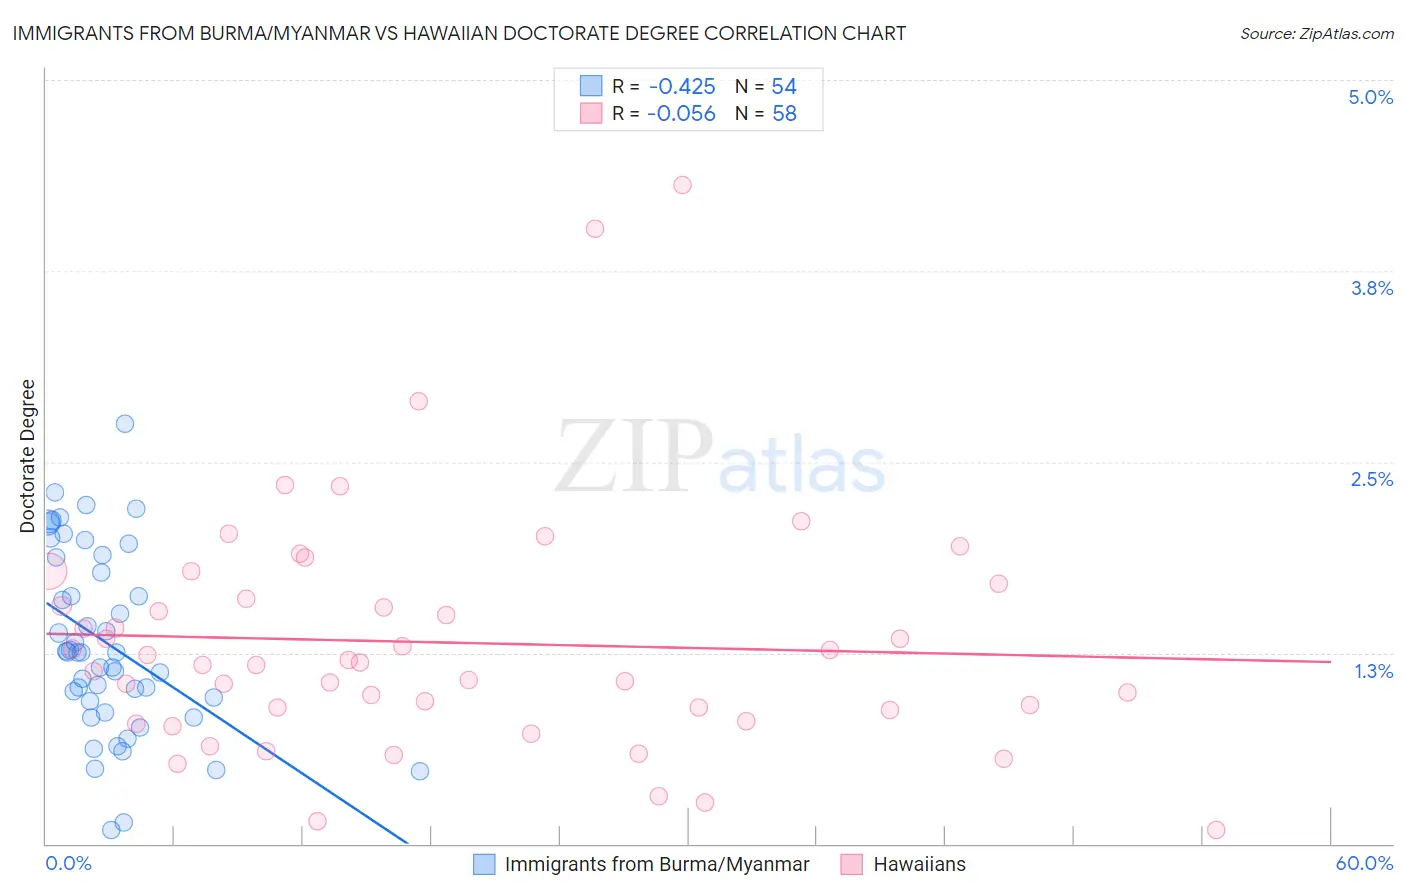
Immigrants from Burma/Myanmar vs Hawaiian Doctorate Degree Correlation Chart
The statistical analysis conducted on geographies consisting of 171,860,396 people shows a moderate negative correlation between the proportion of Immigrants from Burma/Myanmar and percentage of population with at least doctorate degree education in the United States with a correlation coefficient (R) of -0.425 and weighted average of 1.7%. Similarly, the statistical analysis conducted on geographies consisting of 323,773,151 people shows a slight negative correlation between the proportion of Hawaiians and percentage of population with at least doctorate degree education in the United States with a correlation coefficient (R) of -0.056 and weighted average of 1.5%, a difference of 17.2%.
Doctorate Degree Correlation Summary
| Measurement | Immigrants from Burma/Myanmar | Hawaiian |
| Minimum | 0.089% | 0.092% |
| Maximum | 2.7% | 4.3% |
| Range | 2.7% | 4.2% |
| Mean | 1.3% | 1.3% |
| Median | 1.3% | 1.2% |
| Interquartile 25% (IQ1) | 0.93% | 0.88% |
| Interquartile 75% (IQ3) | 1.9% | 1.6% |
| Interquartile Range (IQR) | 0.94% | 0.73% |
| Standard Deviation (Sample) | 0.60% | 0.79% |
| Standard Deviation (Population) | 0.59% | 0.78% |
Similar Demographics by Doctorate Degree
Demographics Similar to Immigrants from Burma/Myanmar by Doctorate Degree
In terms of doctorate degree, the demographic groups most similar to Immigrants from Burma/Myanmar are Alaskan Athabascan (1.7%, a difference of 0.10%), Spanish American (1.7%, a difference of 0.21%), Pueblo (1.7%, a difference of 0.24%), Korean (1.7%, a difference of 0.25%), and Immigrants from South Eastern Asia (1.7%, a difference of 0.39%).
| Demographics | Rating | Rank | Doctorate Degree |
| Immigrants | Western Africa | 15.4 /100 | #209 | Poor 1.7% |
| Tongans | 15.1 /100 | #210 | Poor 1.7% |
| Immigrants | Armenia | 15.1 /100 | #211 | Poor 1.7% |
| Immigrants | South Eastern Asia | 14.7 /100 | #212 | Poor 1.7% |
| Koreans | 14.2 /100 | #213 | Poor 1.7% |
| Pueblo | 14.2 /100 | #214 | Poor 1.7% |
| Alaskan Athabascans | 13.8 /100 | #215 | Poor 1.7% |
| Immigrants | Burma/Myanmar | 13.5 /100 | #216 | Poor 1.7% |
| Spanish Americans | 12.9 /100 | #217 | Poor 1.7% |
| Tlingit-Haida | 11.9 /100 | #218 | Poor 1.7% |
| Immigrants | Iraq | 10.7 /100 | #219 | Poor 1.7% |
| Immigrants | Uruguay | 9.2 /100 | #220 | Tragic 1.7% |
| Immigrants | Nonimmigrants | 8.8 /100 | #221 | Tragic 1.7% |
| Immigrants | Venezuela | 8.7 /100 | #222 | Tragic 1.7% |
| Immigrants | Bosnia and Herzegovina | 7.8 /100 | #223 | Tragic 1.7% |
Demographics Similar to Hawaiians by Doctorate Degree
In terms of doctorate degree, the demographic groups most similar to Hawaiians are Bahamian (1.5%, a difference of 0.060%), Marshallese (1.5%, a difference of 0.22%), Ecuadorian (1.5%, a difference of 0.23%), Tohono O'odham (1.5%, a difference of 0.30%), and British West Indian (1.5%, a difference of 0.35%).
| Demographics | Rating | Rank | Doctorate Degree |
| Immigrants | Trinidad and Tobago | 0.5 /100 | #271 | Tragic 1.5% |
| Immigrants | Barbados | 0.4 /100 | #272 | Tragic 1.5% |
| Sioux | 0.4 /100 | #273 | Tragic 1.5% |
| Yaqui | 0.4 /100 | #274 | Tragic 1.5% |
| Aleuts | 0.4 /100 | #275 | Tragic 1.5% |
| Paiute | 0.4 /100 | #276 | Tragic 1.5% |
| Bahamians | 0.4 /100 | #277 | Tragic 1.5% |
| Hawaiians | 0.4 /100 | #278 | Tragic 1.5% |
| Marshallese | 0.4 /100 | #279 | Tragic 1.5% |
| Ecuadorians | 0.4 /100 | #280 | Tragic 1.5% |
| Tohono O'odham | 0.4 /100 | #281 | Tragic 1.5% |
| British West Indians | 0.3 /100 | #282 | Tragic 1.5% |
| Central Americans | 0.3 /100 | #283 | Tragic 1.5% |
| Jamaicans | 0.3 /100 | #284 | Tragic 1.5% |
| Malaysians | 0.3 /100 | #285 | Tragic 1.5% |