Immigrants from Burma/Myanmar vs Immigrants from Latin America 5th Grade
COMPARE
Immigrants from Burma/Myanmar
Immigrants from Latin America
5th Grade
5th Grade Comparison
Immigrants from Burma/Myanmar
Immigrants from Latin America
96.1%
5TH GRADE
0.0/ 100
METRIC RATING
304th/ 347
METRIC RANK
95.3%
5TH GRADE
0.0/ 100
METRIC RATING
333rd/ 347
METRIC RANK
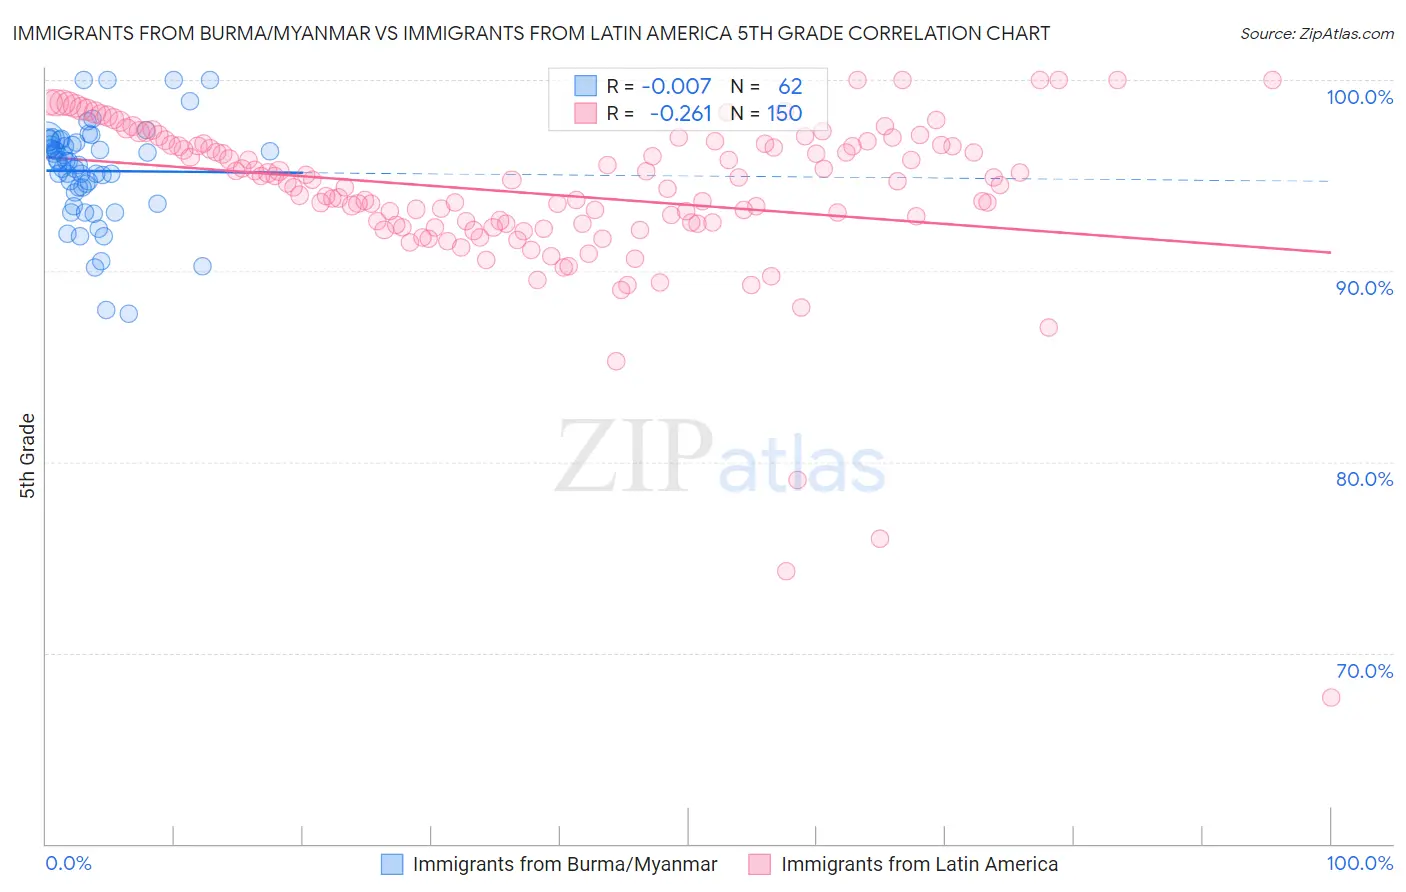
Immigrants from Burma/Myanmar vs Immigrants from Latin America 5th Grade Correlation Chart
The statistical analysis conducted on geographies consisting of 172,326,083 people shows no correlation between the proportion of Immigrants from Burma/Myanmar and percentage of population with at least 5th grade education in the United States with a correlation coefficient (R) of -0.007 and weighted average of 96.1%. Similarly, the statistical analysis conducted on geographies consisting of 558,652,717 people shows a weak negative correlation between the proportion of Immigrants from Latin America and percentage of population with at least 5th grade education in the United States with a correlation coefficient (R) of -0.261 and weighted average of 95.3%, a difference of 0.83%.
5th Grade Correlation Summary
| Measurement | Immigrants from Burma/Myanmar | Immigrants from Latin America |
| Minimum | 87.8% | 67.7% |
| Maximum | 100.0% | 100.0% |
| Range | 12.2% | 32.3% |
| Mean | 95.2% | 94.1% |
| Median | 95.7% | 94.6% |
| Interquartile 25% (IQ1) | 94.1% | 92.4% |
| Interquartile 75% (IQ3) | 96.8% | 96.7% |
| Interquartile Range (IQR) | 2.7% | 4.2% |
| Standard Deviation (Sample) | 2.6% | 4.4% |
| Standard Deviation (Population) | 2.6% | 4.4% |
Similar Demographics by 5th Grade
Demographics Similar to Immigrants from Burma/Myanmar by 5th Grade
In terms of 5th grade, the demographic groups most similar to Immigrants from Burma/Myanmar are Immigrants from Laos (96.0%, a difference of 0.010%), Puerto Rican (96.1%, a difference of 0.030%), Immigrants from Haiti (96.0%, a difference of 0.030%), Immigrants from Caribbean (96.0%, a difference of 0.030%), and Guyanese (96.1%, a difference of 0.040%).
| Demographics | Rating | Rank | 5th Grade |
| Haitians | 0.0 /100 | #297 | Tragic 96.3% |
| Immigrants | Dominica | 0.0 /100 | #298 | Tragic 96.2% |
| Immigrants | Immigrants | 0.0 /100 | #299 | Tragic 96.2% |
| Sri Lankans | 0.0 /100 | #300 | Tragic 96.1% |
| Immigrants | Cuba | 0.0 /100 | #301 | Tragic 96.1% |
| Guyanese | 0.0 /100 | #302 | Tragic 96.1% |
| Puerto Ricans | 0.0 /100 | #303 | Tragic 96.1% |
| Immigrants | Burma/Myanmar | 0.0 /100 | #304 | Tragic 96.1% |
| Immigrants | Laos | 0.0 /100 | #305 | Tragic 96.0% |
| Immigrants | Haiti | 0.0 /100 | #306 | Tragic 96.0% |
| Immigrants | Caribbean | 0.0 /100 | #307 | Tragic 96.0% |
| Ecuadorians | 0.0 /100 | #308 | Tragic 96.0% |
| Immigrants | Guyana | 0.0 /100 | #309 | Tragic 96.0% |
| Indonesians | 0.0 /100 | #310 | Tragic 96.0% |
| Immigrants | Bangladesh | 0.0 /100 | #311 | Tragic 96.0% |
Demographics Similar to Immigrants from Latin America by 5th Grade
In terms of 5th grade, the demographic groups most similar to Immigrants from Latin America are Immigrants from Dominican Republic (95.3%, a difference of 0.0%), Nepalese (95.2%, a difference of 0.030%), Mexican (95.2%, a difference of 0.050%), Immigrants from Honduras (95.4%, a difference of 0.11%), and Immigrants from Armenia (95.4%, a difference of 0.15%).
| Demographics | Rating | Rank | 5th Grade |
| Immigrants | Cambodia | 0.0 /100 | #326 | Tragic 95.5% |
| Dominicans | 0.0 /100 | #327 | Tragic 95.5% |
| Cape Verdeans | 0.0 /100 | #328 | Tragic 95.5% |
| Mexican American Indians | 0.0 /100 | #329 | Tragic 95.5% |
| Immigrants | Armenia | 0.0 /100 | #330 | Tragic 95.4% |
| Immigrants | Honduras | 0.0 /100 | #331 | Tragic 95.4% |
| Immigrants | Dominican Republic | 0.0 /100 | #332 | Tragic 95.3% |
| Immigrants | Latin America | 0.0 /100 | #333 | Tragic 95.3% |
| Nepalese | 0.0 /100 | #334 | Tragic 95.2% |
| Mexicans | 0.0 /100 | #335 | Tragic 95.2% |
| Immigrants | Azores | 0.0 /100 | #336 | Tragic 95.1% |
| Central Americans | 0.0 /100 | #337 | Tragic 95.1% |
| Immigrants | Cabo Verde | 0.0 /100 | #338 | Tragic 94.9% |
| Immigrants | Yemen | 0.0 /100 | #339 | Tragic 94.9% |
| Guatemalans | 0.0 /100 | #340 | Tragic 94.8% |