Immigrants from Burma/Myanmar vs Immigrants from Romania 5th Grade
COMPARE
Immigrants from Burma/Myanmar
Immigrants from Romania
5th Grade
5th Grade Comparison
Immigrants from Burma/Myanmar
Immigrants from Romania
96.1%
5TH GRADE
0.0/ 100
METRIC RATING
304th/ 347
METRIC RANK
97.6%
5TH GRADE
91.6/ 100
METRIC RATING
130th/ 347
METRIC RANK
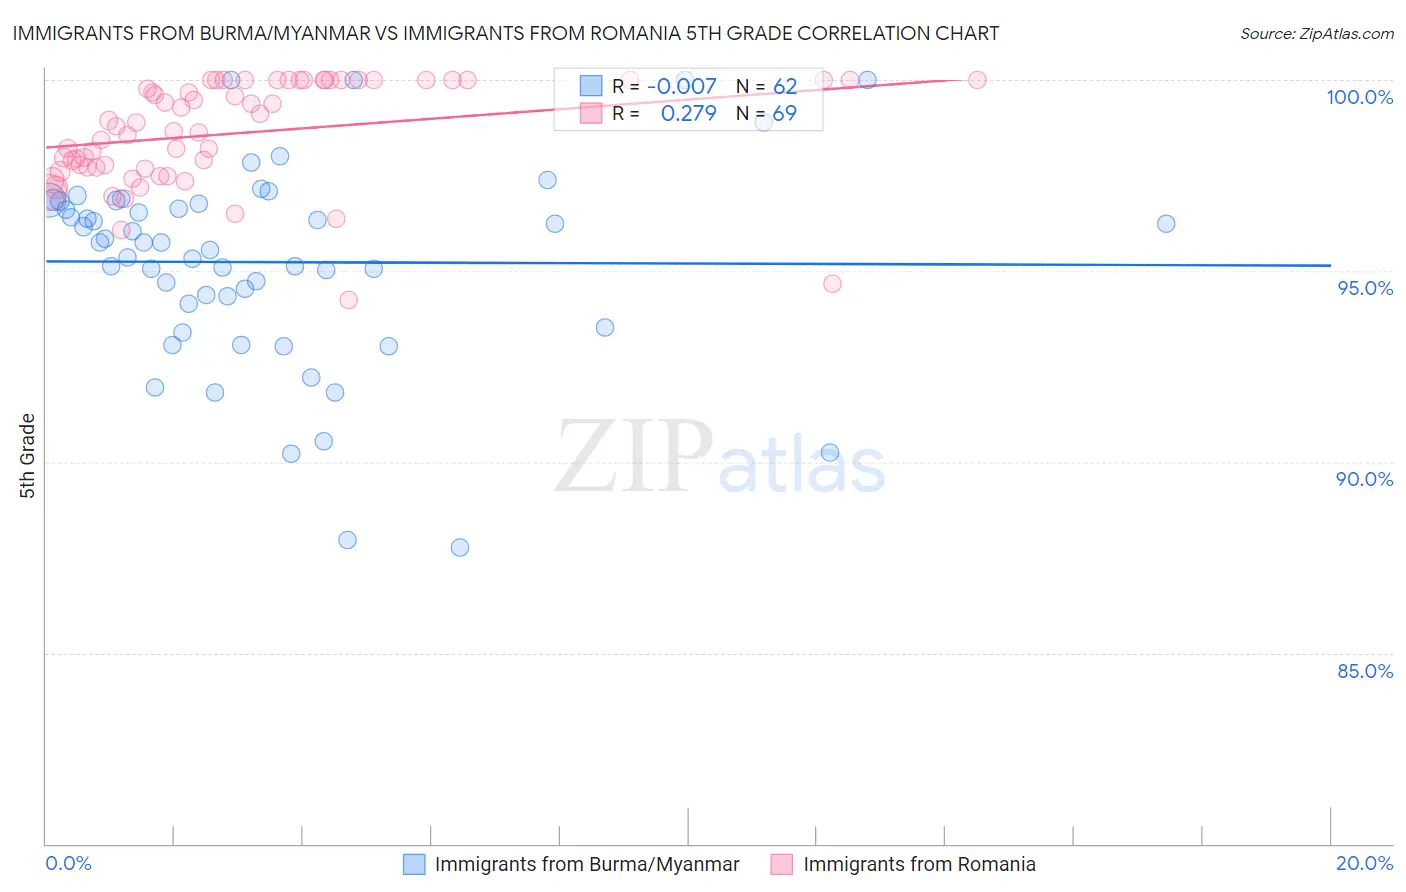
Immigrants from Burma/Myanmar vs Immigrants from Romania 5th Grade Correlation Chart
The statistical analysis conducted on geographies consisting of 172,326,083 people shows no correlation between the proportion of Immigrants from Burma/Myanmar and percentage of population with at least 5th grade education in the United States with a correlation coefficient (R) of -0.007 and weighted average of 96.1%. Similarly, the statistical analysis conducted on geographies consisting of 257,008,799 people shows a weak positive correlation between the proportion of Immigrants from Romania and percentage of population with at least 5th grade education in the United States with a correlation coefficient (R) of 0.279 and weighted average of 97.6%, a difference of 1.6%.
5th Grade Correlation Summary
| Measurement | Immigrants from Burma/Myanmar | Immigrants from Romania |
| Minimum | 87.8% | 94.3% |
| Maximum | 100.0% | 100.0% |
| Range | 12.2% | 5.7% |
| Mean | 95.2% | 98.6% |
| Median | 95.7% | 98.8% |
| Interquartile 25% (IQ1) | 94.1% | 97.7% |
| Interquartile 75% (IQ3) | 96.8% | 100.0% |
| Interquartile Range (IQR) | 2.7% | 2.3% |
| Standard Deviation (Sample) | 2.6% | 1.4% |
| Standard Deviation (Population) | 2.6% | 1.4% |
Similar Demographics by 5th Grade
Demographics Similar to Immigrants from Burma/Myanmar by 5th Grade
In terms of 5th grade, the demographic groups most similar to Immigrants from Burma/Myanmar are Immigrants from Laos (96.0%, a difference of 0.010%), Puerto Rican (96.1%, a difference of 0.030%), Immigrants from Haiti (96.0%, a difference of 0.030%), Immigrants from Caribbean (96.0%, a difference of 0.030%), and Guyanese (96.1%, a difference of 0.040%).
| Demographics | Rating | Rank | 5th Grade |
| Haitians | 0.0 /100 | #297 | Tragic 96.3% |
| Immigrants | Dominica | 0.0 /100 | #298 | Tragic 96.2% |
| Immigrants | Immigrants | 0.0 /100 | #299 | Tragic 96.2% |
| Sri Lankans | 0.0 /100 | #300 | Tragic 96.1% |
| Immigrants | Cuba | 0.0 /100 | #301 | Tragic 96.1% |
| Guyanese | 0.0 /100 | #302 | Tragic 96.1% |
| Puerto Ricans | 0.0 /100 | #303 | Tragic 96.1% |
| Immigrants | Burma/Myanmar | 0.0 /100 | #304 | Tragic 96.1% |
| Immigrants | Laos | 0.0 /100 | #305 | Tragic 96.0% |
| Immigrants | Haiti | 0.0 /100 | #306 | Tragic 96.0% |
| Immigrants | Caribbean | 0.0 /100 | #307 | Tragic 96.0% |
| Ecuadorians | 0.0 /100 | #308 | Tragic 96.0% |
| Immigrants | Guyana | 0.0 /100 | #309 | Tragic 96.0% |
| Indonesians | 0.0 /100 | #310 | Tragic 96.0% |
| Immigrants | Bangladesh | 0.0 /100 | #311 | Tragic 96.0% |
Demographics Similar to Immigrants from Romania by 5th Grade
In terms of 5th grade, the demographic groups most similar to Immigrants from Romania are Immigrants from Europe (97.6%, a difference of 0.0%), Hmong (97.6%, a difference of 0.010%), Immigrants from Serbia (97.6%, a difference of 0.010%), Colville (97.6%, a difference of 0.010%), and Pima (97.6%, a difference of 0.010%).
| Demographics | Rating | Rank | 5th Grade |
| Immigrants | Norway | 94.6 /100 | #123 | Exceptional 97.6% |
| Spanish | 93.7 /100 | #124 | Exceptional 97.6% |
| Immigrants | Bulgaria | 93.1 /100 | #125 | Exceptional 97.6% |
| Hmong | 92.3 /100 | #126 | Exceptional 97.6% |
| Immigrants | Serbia | 92.3 /100 | #127 | Exceptional 97.6% |
| Colville | 92.0 /100 | #128 | Exceptional 97.6% |
| Immigrants | Europe | 91.9 /100 | #129 | Exceptional 97.6% |
| Immigrants | Romania | 91.6 /100 | #130 | Exceptional 97.6% |
| Pima | 91.2 /100 | #131 | Exceptional 97.6% |
| Immigrants | Kuwait | 90.4 /100 | #132 | Exceptional 97.6% |
| Cambodians | 90.2 /100 | #133 | Exceptional 97.6% |
| Immigrants | Hungary | 90.1 /100 | #134 | Exceptional 97.6% |
| Palestinians | 89.3 /100 | #135 | Excellent 97.5% |
| Immigrants | Moldova | 87.5 /100 | #136 | Excellent 97.5% |
| Filipinos | 86.8 /100 | #137 | Excellent 97.5% |