Cypriot vs Immigrants from Somalia 5th Grade
COMPARE
Cypriot
Immigrants from Somalia
5th Grade
5th Grade Comparison
Cypriots
Immigrants from Somalia
97.8%
5TH GRADE
98.9/ 100
METRIC RATING
86th/ 347
METRIC RANK
96.4%
5TH GRADE
0.0/ 100
METRIC RATING
295th/ 347
METRIC RANK
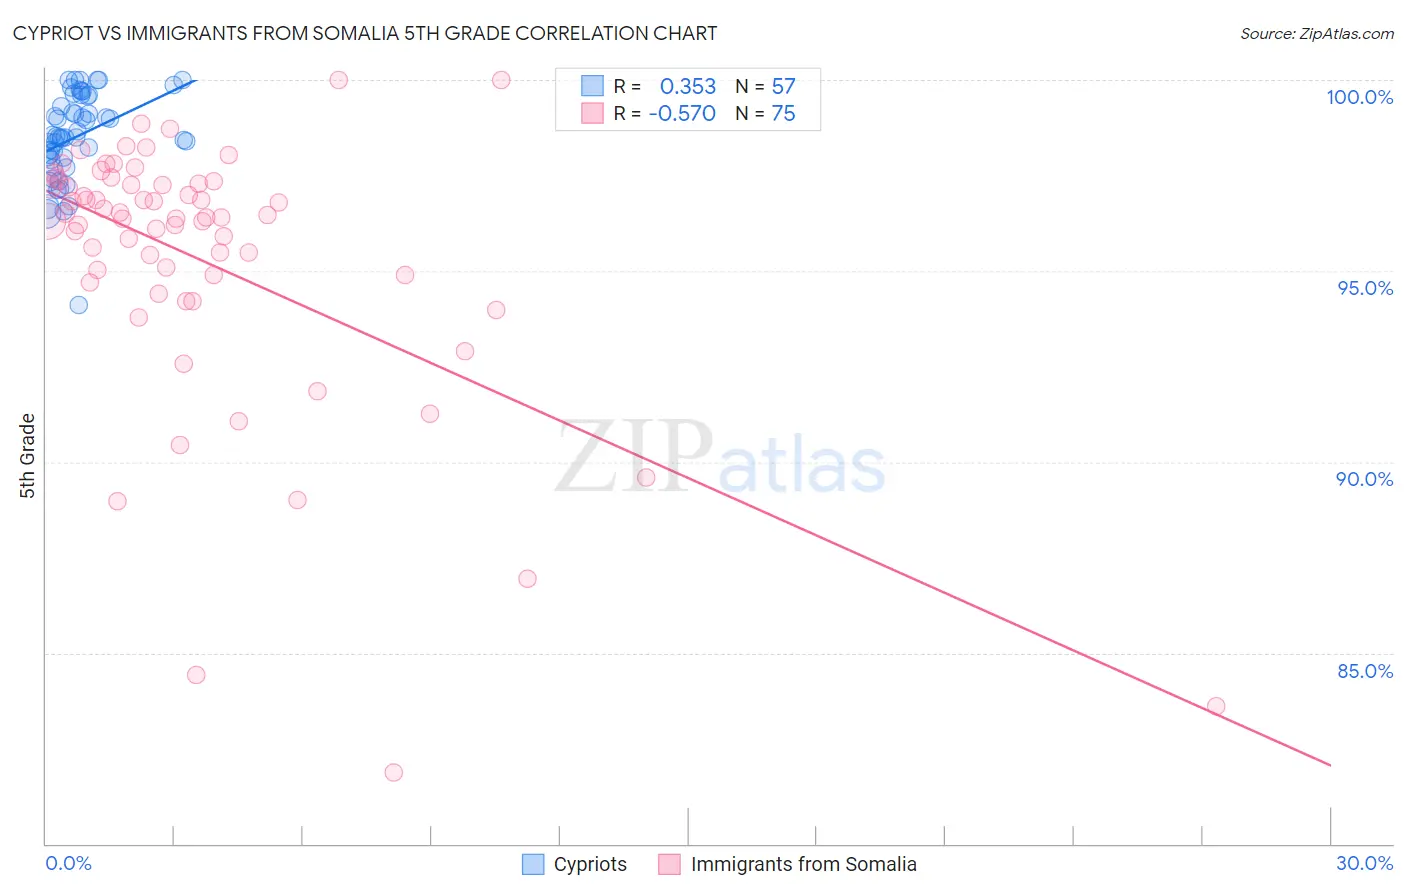
Cypriot vs Immigrants from Somalia 5th Grade Correlation Chart
The statistical analysis conducted on geographies consisting of 61,870,289 people shows a mild positive correlation between the proportion of Cypriots and percentage of population with at least 5th grade education in the United States with a correlation coefficient (R) of 0.353 and weighted average of 97.8%. Similarly, the statistical analysis conducted on geographies consisting of 92,109,166 people shows a substantial negative correlation between the proportion of Immigrants from Somalia and percentage of population with at least 5th grade education in the United States with a correlation coefficient (R) of -0.570 and weighted average of 96.4%, a difference of 1.5%.
5th Grade Correlation Summary
| Measurement | Cypriot | Immigrants from Somalia |
| Minimum | 94.1% | 81.9% |
| Maximum | 100.0% | 100.0% |
| Range | 5.9% | 18.1% |
| Mean | 98.5% | 95.3% |
| Median | 98.5% | 96.4% |
| Interquartile 25% (IQ1) | 97.9% | 94.7% |
| Interquartile 75% (IQ3) | 99.6% | 97.3% |
| Interquartile Range (IQR) | 1.6% | 2.6% |
| Standard Deviation (Sample) | 1.2% | 3.5% |
| Standard Deviation (Population) | 1.1% | 3.5% |
Similar Demographics by 5th Grade
Demographics Similar to Cypriots by 5th Grade
In terms of 5th grade, the demographic groups most similar to Cypriots are Zimbabwean (97.8%, a difference of 0.010%), Potawatomi (97.8%, a difference of 0.010%), Immigrants from Belgium (97.8%, a difference of 0.010%), Immigrants from Australia (97.8%, a difference of 0.010%), and Shoshone (97.8%, a difference of 0.010%).
| Demographics | Rating | Rank | 5th Grade |
| Immigrants | Lithuania | 99.2 /100 | #79 | Exceptional 97.8% |
| Immigrants | India | 99.2 /100 | #80 | Exceptional 97.8% |
| Icelanders | 99.2 /100 | #81 | Exceptional 97.8% |
| Pueblo | 99.2 /100 | #82 | Exceptional 97.8% |
| Zimbabweans | 99.0 /100 | #83 | Exceptional 97.8% |
| Potawatomi | 99.0 /100 | #84 | Exceptional 97.8% |
| Immigrants | Belgium | 99.0 /100 | #85 | Exceptional 97.8% |
| Cypriots | 98.9 /100 | #86 | Exceptional 97.8% |
| Immigrants | Australia | 98.8 /100 | #87 | Exceptional 97.8% |
| Shoshone | 98.8 /100 | #88 | Exceptional 97.8% |
| Immigrants | South Africa | 98.8 /100 | #89 | Exceptional 97.8% |
| Immigrants | Ireland | 98.8 /100 | #90 | Exceptional 97.8% |
| Immigrants | Western Europe | 98.8 /100 | #91 | Exceptional 97.8% |
| Immigrants | Sweden | 98.7 /100 | #92 | Exceptional 97.8% |
| Delaware | 98.6 /100 | #93 | Exceptional 97.8% |
Demographics Similar to Immigrants from Somalia by 5th Grade
In terms of 5th grade, the demographic groups most similar to Immigrants from Somalia are Immigrants from Eritrea (96.4%, a difference of 0.040%), Immigrants from Grenada (96.5%, a difference of 0.080%), Malaysian (96.5%, a difference of 0.090%), Somali (96.5%, a difference of 0.090%), and British West Indian (96.5%, a difference of 0.10%).
| Demographics | Rating | Rank | 5th Grade |
| Immigrants | Barbados | 0.0 /100 | #288 | Tragic 96.6% |
| Immigrants | West Indies | 0.0 /100 | #289 | Tragic 96.5% |
| British West Indians | 0.0 /100 | #290 | Tragic 96.5% |
| Malaysians | 0.0 /100 | #291 | Tragic 96.5% |
| Somalis | 0.0 /100 | #292 | Tragic 96.5% |
| Immigrants | Grenada | 0.0 /100 | #293 | Tragic 96.5% |
| Immigrants | Eritrea | 0.0 /100 | #294 | Tragic 96.4% |
| Immigrants | Somalia | 0.0 /100 | #295 | Tragic 96.4% |
| Immigrants | South Eastern Asia | 0.0 /100 | #296 | Tragic 96.3% |
| Haitians | 0.0 /100 | #297 | Tragic 96.3% |
| Immigrants | Dominica | 0.0 /100 | #298 | Tragic 96.2% |
| Immigrants | Immigrants | 0.0 /100 | #299 | Tragic 96.2% |
| Sri Lankans | 0.0 /100 | #300 | Tragic 96.1% |
| Immigrants | Cuba | 0.0 /100 | #301 | Tragic 96.1% |
| Guyanese | 0.0 /100 | #302 | Tragic 96.1% |