Korean vs Immigrants from Somalia 5th Grade
COMPARE
Korean
Immigrants from Somalia
5th Grade
5th Grade Comparison
Koreans
Immigrants from Somalia
96.9%
5TH GRADE
1.6/ 100
METRIC RATING
244th/ 347
METRIC RANK
96.4%
5TH GRADE
0.0/ 100
METRIC RATING
295th/ 347
METRIC RANK
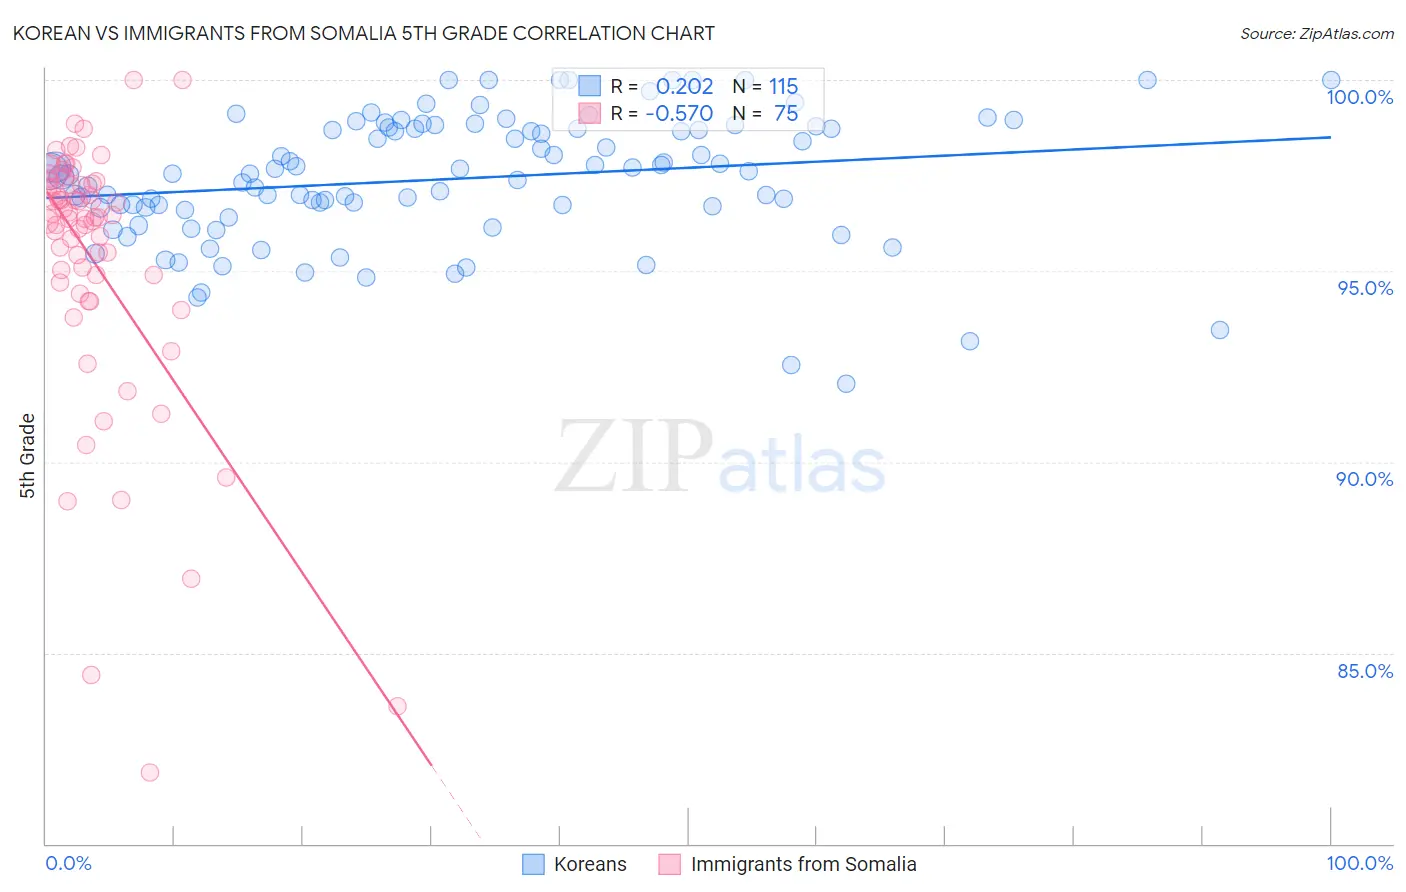
Korean vs Immigrants from Somalia 5th Grade Correlation Chart
The statistical analysis conducted on geographies consisting of 510,946,101 people shows a weak positive correlation between the proportion of Koreans and percentage of population with at least 5th grade education in the United States with a correlation coefficient (R) of 0.202 and weighted average of 96.9%. Similarly, the statistical analysis conducted on geographies consisting of 92,109,166 people shows a substantial negative correlation between the proportion of Immigrants from Somalia and percentage of population with at least 5th grade education in the United States with a correlation coefficient (R) of -0.570 and weighted average of 96.4%, a difference of 0.55%.
5th Grade Correlation Summary
| Measurement | Korean | Immigrants from Somalia |
| Minimum | 92.0% | 81.9% |
| Maximum | 100.0% | 100.0% |
| Range | 8.0% | 18.1% |
| Mean | 97.4% | 95.3% |
| Median | 97.5% | 96.4% |
| Interquartile 25% (IQ1) | 96.7% | 94.7% |
| Interquartile 75% (IQ3) | 98.7% | 97.3% |
| Interquartile Range (IQR) | 2.1% | 2.6% |
| Standard Deviation (Sample) | 1.7% | 3.5% |
| Standard Deviation (Population) | 1.7% | 3.5% |
Similar Demographics by 5th Grade
Demographics Similar to Koreans by 5th Grade
In terms of 5th grade, the demographic groups most similar to Koreans are Immigrants from Costa Rica (96.9%, a difference of 0.0%), Immigrants from Eastern Africa (96.9%, a difference of 0.0%), Immigrants from Asia (96.9%, a difference of 0.010%), Asian (96.9%, a difference of 0.020%), and Nigerian (96.9%, a difference of 0.020%).
| Demographics | Rating | Rank | 5th Grade |
| Immigrants | Indonesia | 2.0 /100 | #237 | Tragic 96.9% |
| Asians | 2.0 /100 | #238 | Tragic 96.9% |
| Nigerians | 1.9 /100 | #239 | Tragic 96.9% |
| Indians (Asian) | 1.9 /100 | #240 | Tragic 96.9% |
| Immigrants | Asia | 1.7 /100 | #241 | Tragic 96.9% |
| Immigrants | Costa Rica | 1.6 /100 | #242 | Tragic 96.9% |
| Immigrants | Eastern Africa | 1.6 /100 | #243 | Tragic 96.9% |
| Koreans | 1.6 /100 | #244 | Tragic 96.9% |
| Colombians | 1.3 /100 | #245 | Tragic 96.9% |
| Ethiopians | 1.2 /100 | #246 | Tragic 96.9% |
| Immigrants | Africa | 1.1 /100 | #247 | Tragic 96.9% |
| U.S. Virgin Islanders | 1.1 /100 | #248 | Tragic 96.9% |
| Immigrants | Uruguay | 1.0 /100 | #249 | Tragic 96.9% |
| Immigrants | Liberia | 1.0 /100 | #250 | Tragic 96.9% |
| Bolivians | 0.9 /100 | #251 | Tragic 96.9% |
Demographics Similar to Immigrants from Somalia by 5th Grade
In terms of 5th grade, the demographic groups most similar to Immigrants from Somalia are Immigrants from Eritrea (96.4%, a difference of 0.040%), Immigrants from Grenada (96.5%, a difference of 0.080%), Malaysian (96.5%, a difference of 0.090%), Somali (96.5%, a difference of 0.090%), and British West Indian (96.5%, a difference of 0.10%).
| Demographics | Rating | Rank | 5th Grade |
| Immigrants | Barbados | 0.0 /100 | #288 | Tragic 96.6% |
| Immigrants | West Indies | 0.0 /100 | #289 | Tragic 96.5% |
| British West Indians | 0.0 /100 | #290 | Tragic 96.5% |
| Malaysians | 0.0 /100 | #291 | Tragic 96.5% |
| Somalis | 0.0 /100 | #292 | Tragic 96.5% |
| Immigrants | Grenada | 0.0 /100 | #293 | Tragic 96.5% |
| Immigrants | Eritrea | 0.0 /100 | #294 | Tragic 96.4% |
| Immigrants | Somalia | 0.0 /100 | #295 | Tragic 96.4% |
| Immigrants | South Eastern Asia | 0.0 /100 | #296 | Tragic 96.3% |
| Haitians | 0.0 /100 | #297 | Tragic 96.3% |
| Immigrants | Dominica | 0.0 /100 | #298 | Tragic 96.2% |
| Immigrants | Immigrants | 0.0 /100 | #299 | Tragic 96.2% |
| Sri Lankans | 0.0 /100 | #300 | Tragic 96.1% |
| Immigrants | Cuba | 0.0 /100 | #301 | Tragic 96.1% |
| Guyanese | 0.0 /100 | #302 | Tragic 96.1% |