Uruguayan vs Immigrants from India 11th Grade
COMPARE
Uruguayan
Immigrants from India
11th Grade
11th Grade Comparison
Uruguayans
Immigrants from India
91.8%
11TH GRADE
3.5/ 100
METRIC RATING
232nd/ 347
METRIC RANK
94.5%
11TH GRADE
100.0/ 100
METRIC RATING
16th/ 347
METRIC RANK
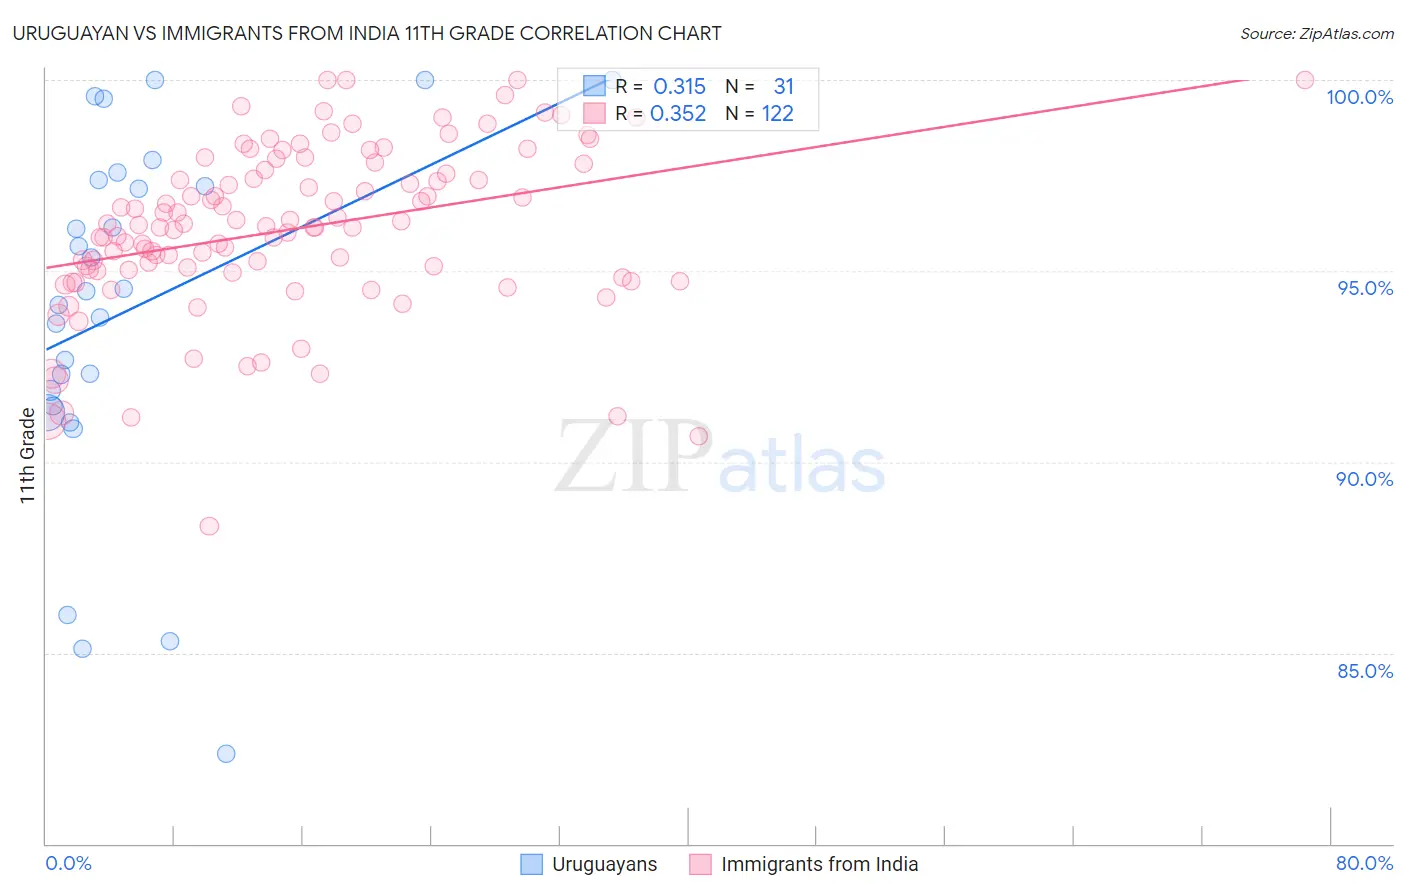
Uruguayan vs Immigrants from India 11th Grade Correlation Chart
The statistical analysis conducted on geographies consisting of 144,782,615 people shows a mild positive correlation between the proportion of Uruguayans and percentage of population with at least 11th grade education in the United States with a correlation coefficient (R) of 0.315 and weighted average of 91.8%. Similarly, the statistical analysis conducted on geographies consisting of 434,105,625 people shows a mild positive correlation between the proportion of Immigrants from India and percentage of population with at least 11th grade education in the United States with a correlation coefficient (R) of 0.352 and weighted average of 94.5%, a difference of 3.0%.
11th Grade Correlation Summary
| Measurement | Uruguayan | Immigrants from India |
| Minimum | 82.4% | 88.3% |
| Maximum | 100.0% | 100.0% |
| Range | 17.6% | 11.7% |
| Mean | 94.0% | 96.1% |
| Median | 94.5% | 96.2% |
| Interquartile 25% (IQ1) | 91.5% | 95.0% |
| Interquartile 75% (IQ3) | 97.4% | 97.7% |
| Interquartile Range (IQR) | 5.9% | 2.7% |
| Standard Deviation (Sample) | 4.6% | 2.2% |
| Standard Deviation (Population) | 4.6% | 2.2% |
Similar Demographics by 11th Grade
Demographics Similar to Uruguayans by 11th Grade
In terms of 11th grade, the demographic groups most similar to Uruguayans are Cheyenne (91.8%, a difference of 0.010%), Choctaw (91.8%, a difference of 0.020%), Immigrants from Afghanistan (91.8%, a difference of 0.030%), Armenian (91.7%, a difference of 0.040%), and Nigerian (91.8%, a difference of 0.050%).
| Demographics | Rating | Rank | 11th Grade |
| Immigrants | Zaire | 5.4 /100 | #225 | Tragic 91.9% |
| Immigrants | Somalia | 5.2 /100 | #226 | Tragic 91.9% |
| Immigrants | Cameroon | 4.4 /100 | #227 | Tragic 91.8% |
| Immigrants | Panama | 4.3 /100 | #228 | Tragic 91.8% |
| Nigerians | 4.3 /100 | #229 | Tragic 91.8% |
| Immigrants | Afghanistan | 3.9 /100 | #230 | Tragic 91.8% |
| Choctaw | 3.7 /100 | #231 | Tragic 91.8% |
| Uruguayans | 3.5 /100 | #232 | Tragic 91.8% |
| Cheyenne | 3.3 /100 | #233 | Tragic 91.8% |
| Armenians | 2.9 /100 | #234 | Tragic 91.7% |
| Sub-Saharan Africans | 2.9 /100 | #235 | Tragic 91.7% |
| Colombians | 2.8 /100 | #236 | Tragic 91.7% |
| Immigrants | Bolivia | 2.8 /100 | #237 | Tragic 91.7% |
| Comanche | 2.6 /100 | #238 | Tragic 91.7% |
| Hopi | 2.5 /100 | #239 | Tragic 91.7% |
Demographics Similar to Immigrants from India by 11th Grade
In terms of 11th grade, the demographic groups most similar to Immigrants from India are Luxembourger (94.5%, a difference of 0.0%), Bulgarian (94.5%, a difference of 0.010%), Maltese (94.5%, a difference of 0.010%), Scandinavian (94.5%, a difference of 0.010%), and Italian (94.5%, a difference of 0.040%).
| Demographics | Rating | Rank | 11th Grade |
| Danes | 100.0 /100 | #9 | Exceptional 94.7% |
| Finns | 100.0 /100 | #10 | Exceptional 94.7% |
| Germans | 100.0 /100 | #11 | Exceptional 94.7% |
| Latvians | 100.0 /100 | #12 | Exceptional 94.7% |
| Chinese | 100.0 /100 | #13 | Exceptional 94.6% |
| Eastern Europeans | 100.0 /100 | #14 | Exceptional 94.6% |
| Bulgarians | 100.0 /100 | #15 | Exceptional 94.5% |
| Immigrants | India | 100.0 /100 | #16 | Exceptional 94.5% |
| Luxembourgers | 100.0 /100 | #17 | Exceptional 94.5% |
| Maltese | 100.0 /100 | #18 | Exceptional 94.5% |
| Scandinavians | 100.0 /100 | #19 | Exceptional 94.5% |
| Italians | 100.0 /100 | #20 | Exceptional 94.5% |
| Tlingit-Haida | 100.0 /100 | #21 | Exceptional 94.4% |
| Tsimshian | 100.0 /100 | #22 | Exceptional 94.4% |
| Czechs | 100.0 /100 | #23 | Exceptional 94.4% |