Immigrants from Burma/Myanmar vs Immigrants from Vietnam 7th Grade
COMPARE
Immigrants from Burma/Myanmar
Immigrants from Vietnam
7th Grade
7th Grade Comparison
Immigrants from Burma/Myanmar
Immigrants from Vietnam
94.5%
7TH GRADE
0.0/ 100
METRIC RATING
300th/ 347
METRIC RANK
93.9%
7TH GRADE
0.0/ 100
METRIC RATING
316th/ 347
METRIC RANK
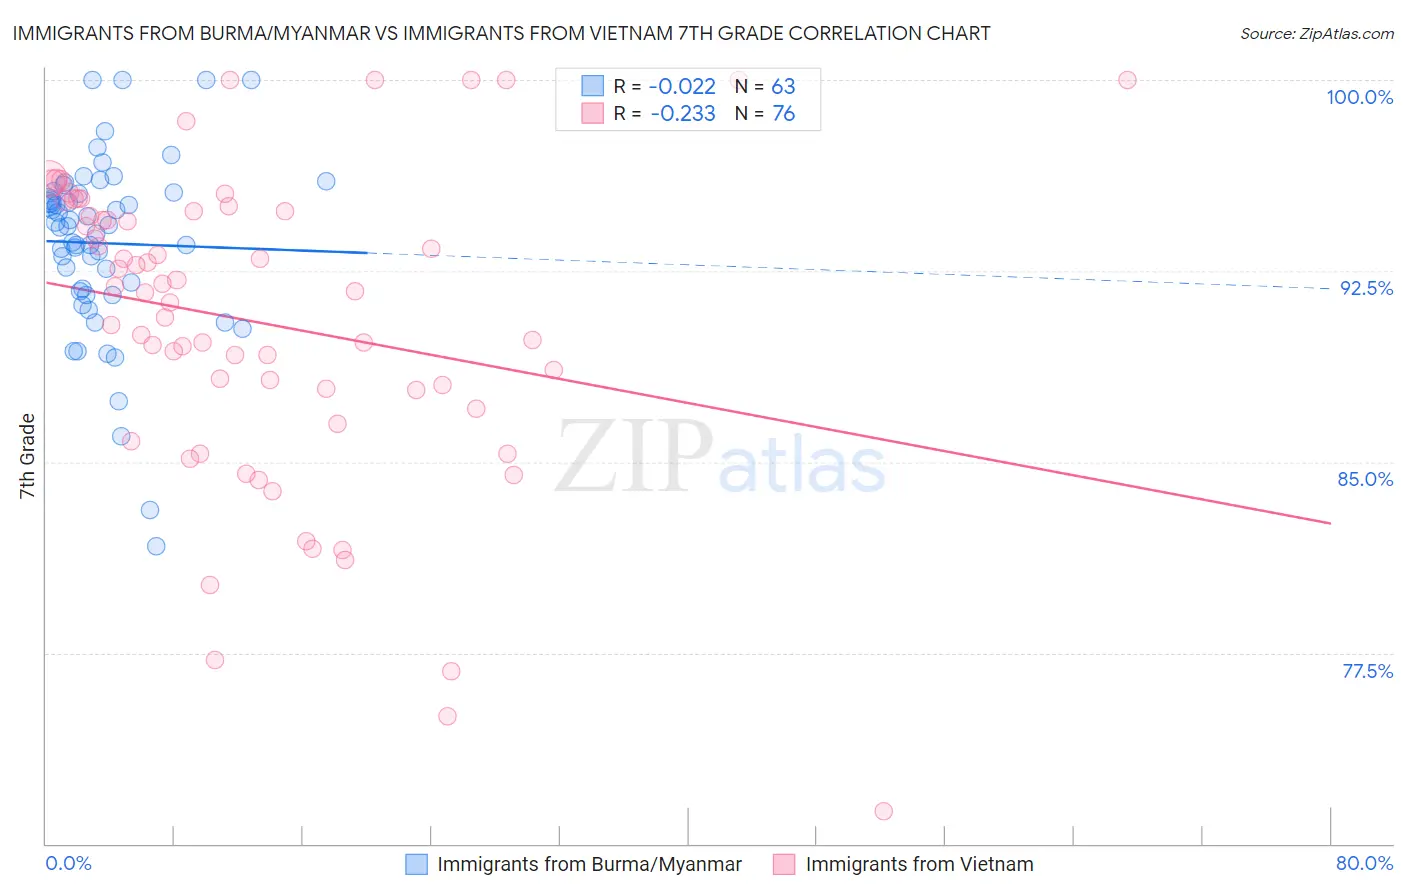
Immigrants from Burma/Myanmar vs Immigrants from Vietnam 7th Grade Correlation Chart
The statistical analysis conducted on geographies consisting of 172,345,696 people shows no correlation between the proportion of Immigrants from Burma/Myanmar and percentage of population with at least 7th grade education in the United States with a correlation coefficient (R) of -0.022 and weighted average of 94.5%. Similarly, the statistical analysis conducted on geographies consisting of 404,844,322 people shows a weak negative correlation between the proportion of Immigrants from Vietnam and percentage of population with at least 7th grade education in the United States with a correlation coefficient (R) of -0.233 and weighted average of 93.9%, a difference of 0.64%.
7th Grade Correlation Summary
| Measurement | Immigrants from Burma/Myanmar | Immigrants from Vietnam |
| Minimum | 81.7% | 71.3% |
| Maximum | 100.0% | 100.0% |
| Range | 18.3% | 28.7% |
| Mean | 93.6% | 90.5% |
| Median | 94.3% | 91.7% |
| Interquartile 25% (IQ1) | 91.7% | 87.5% |
| Interquartile 75% (IQ3) | 95.6% | 94.9% |
| Interquartile Range (IQR) | 3.9% | 7.4% |
| Standard Deviation (Sample) | 3.6% | 6.1% |
| Standard Deviation (Population) | 3.5% | 6.1% |
Demographics Similar to Immigrants from Burma/Myanmar and Immigrants from Vietnam by 7th Grade
In terms of 7th grade, the demographic groups most similar to Immigrants from Burma/Myanmar are Immigrants from Dominica (94.5%, a difference of 0.030%), Immigrants from Laos (94.5%, a difference of 0.030%), Indonesian (94.5%, a difference of 0.040%), Bangladeshi (94.5%, a difference of 0.040%), and Sri Lankan (94.4%, a difference of 0.12%). Similarly, the demographic groups most similar to Immigrants from Vietnam are Vietnamese (93.9%, a difference of 0.030%), Japanese (94.0%, a difference of 0.080%), Immigrants from Cuba (93.8%, a difference of 0.090%), Immigrants (94.0%, a difference of 0.11%), and Immigrants from Bangladesh (94.0%, a difference of 0.11%).
| Demographics | Rating | Rank | 7th Grade |
| Indonesians | 0.0 /100 | #298 | Tragic 94.5% |
| Bangladeshis | 0.0 /100 | #299 | Tragic 94.5% |
| Immigrants | Burma/Myanmar | 0.0 /100 | #300 | Tragic 94.5% |
| Immigrants | Dominica | 0.0 /100 | #301 | Tragic 94.5% |
| Immigrants | Laos | 0.0 /100 | #302 | Tragic 94.5% |
| Sri Lankans | 0.0 /100 | #303 | Tragic 94.4% |
| Immigrants | Haiti | 0.0 /100 | #304 | Tragic 94.3% |
| Guyanese | 0.0 /100 | #305 | Tragic 94.3% |
| Immigrants | Guyana | 0.0 /100 | #306 | Tragic 94.2% |
| Immigrants | Portugal | 0.0 /100 | #307 | Tragic 94.2% |
| Cape Verdeans | 0.0 /100 | #308 | Tragic 94.1% |
| Ecuadorians | 0.0 /100 | #309 | Tragic 94.0% |
| Immigrants | Caribbean | 0.0 /100 | #310 | Tragic 94.0% |
| Puerto Ricans | 0.0 /100 | #311 | Tragic 94.0% |
| Immigrants | Immigrants | 0.0 /100 | #312 | Tragic 94.0% |
| Immigrants | Bangladesh | 0.0 /100 | #313 | Tragic 94.0% |
| Japanese | 0.0 /100 | #314 | Tragic 94.0% |
| Vietnamese | 0.0 /100 | #315 | Tragic 93.9% |
| Immigrants | Vietnam | 0.0 /100 | #316 | Tragic 93.9% |
| Immigrants | Cuba | 0.0 /100 | #317 | Tragic 93.8% |
| Immigrants | Ecuador | 0.0 /100 | #318 | Tragic 93.7% |