Immigrants from Burma/Myanmar vs Immigrants from Egypt 7th Grade
COMPARE
Immigrants from Burma/Myanmar
Immigrants from Egypt
7th Grade
7th Grade Comparison
Immigrants from Burma/Myanmar
Immigrants from Egypt
94.5%
7TH GRADE
0.0/ 100
METRIC RATING
300th/ 347
METRIC RANK
95.9%
7TH GRADE
34.3/ 100
METRIC RATING
188th/ 347
METRIC RANK
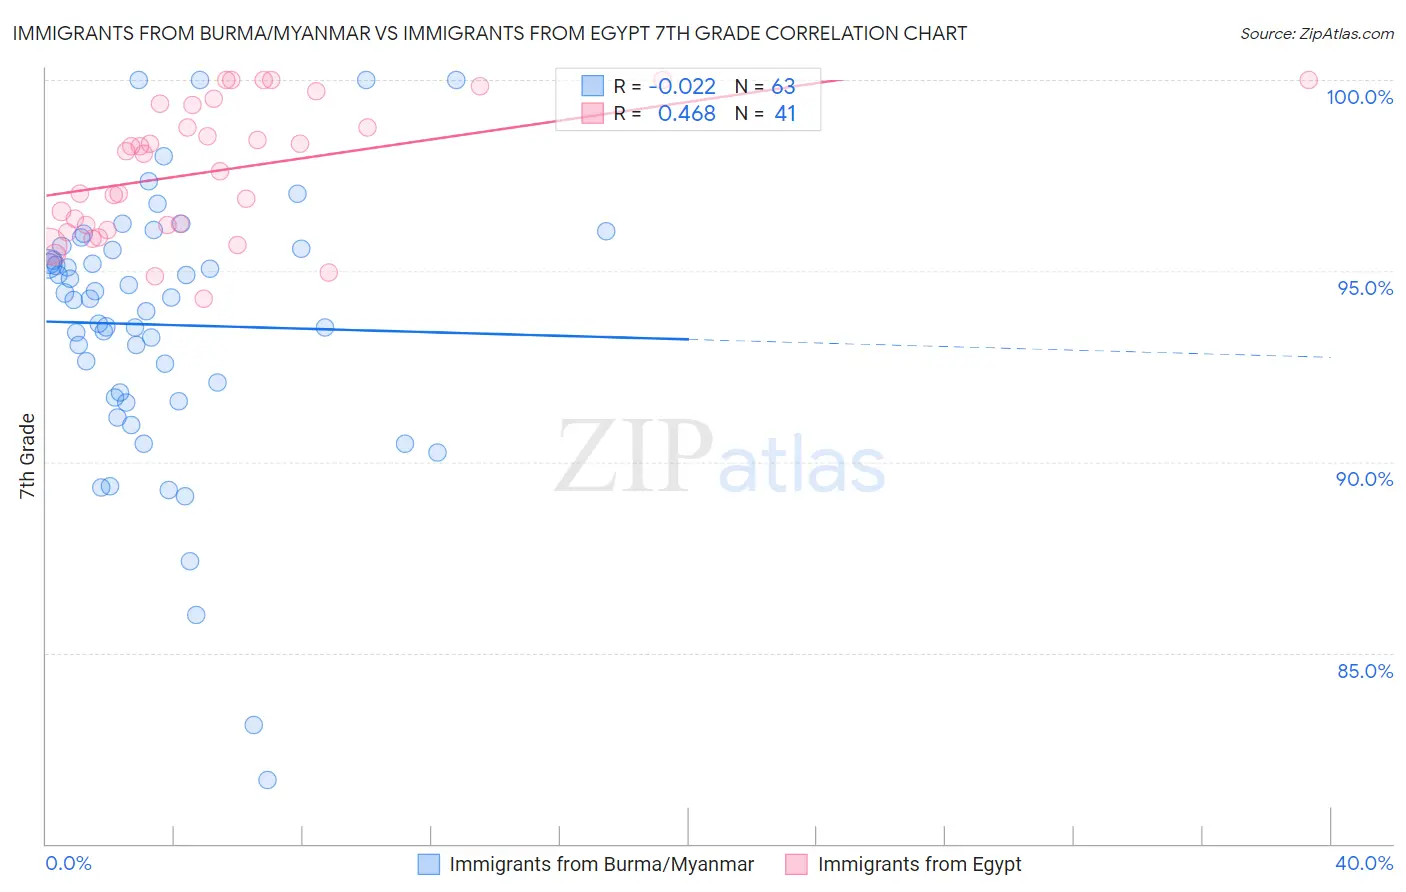
Immigrants from Burma/Myanmar vs Immigrants from Egypt 7th Grade Correlation Chart
The statistical analysis conducted on geographies consisting of 172,345,696 people shows no correlation between the proportion of Immigrants from Burma/Myanmar and percentage of population with at least 7th grade education in the United States with a correlation coefficient (R) of -0.022 and weighted average of 94.5%. Similarly, the statistical analysis conducted on geographies consisting of 245,485,794 people shows a moderate positive correlation between the proportion of Immigrants from Egypt and percentage of population with at least 7th grade education in the United States with a correlation coefficient (R) of 0.468 and weighted average of 95.9%, a difference of 1.5%.
7th Grade Correlation Summary
| Measurement | Immigrants from Burma/Myanmar | Immigrants from Egypt |
| Minimum | 81.7% | 94.3% |
| Maximum | 100.0% | 100.0% |
| Range | 18.3% | 5.7% |
| Mean | 93.6% | 97.6% |
| Median | 94.3% | 98.1% |
| Interquartile 25% (IQ1) | 91.7% | 96.1% |
| Interquartile 75% (IQ3) | 95.6% | 99.4% |
| Interquartile Range (IQR) | 3.9% | 3.2% |
| Standard Deviation (Sample) | 3.6% | 1.7% |
| Standard Deviation (Population) | 3.5% | 1.7% |
Similar Demographics by 7th Grade
Demographics Similar to Immigrants from Burma/Myanmar by 7th Grade
In terms of 7th grade, the demographic groups most similar to Immigrants from Burma/Myanmar are Immigrants from Dominica (94.5%, a difference of 0.030%), Immigrants from Laos (94.5%, a difference of 0.030%), Immigrants from South Eastern Asia (94.5%, a difference of 0.040%), Indonesian (94.5%, a difference of 0.040%), and Bangladeshi (94.5%, a difference of 0.040%).
| Demographics | Rating | Rank | 7th Grade |
| Fijians | 0.0 /100 | #293 | Tragic 94.7% |
| Haitians | 0.0 /100 | #294 | Tragic 94.7% |
| Yaqui | 0.0 /100 | #295 | Tragic 94.6% |
| Cubans | 0.0 /100 | #296 | Tragic 94.6% |
| Immigrants | South Eastern Asia | 0.0 /100 | #297 | Tragic 94.5% |
| Indonesians | 0.0 /100 | #298 | Tragic 94.5% |
| Bangladeshis | 0.0 /100 | #299 | Tragic 94.5% |
| Immigrants | Burma/Myanmar | 0.0 /100 | #300 | Tragic 94.5% |
| Immigrants | Dominica | 0.0 /100 | #301 | Tragic 94.5% |
| Immigrants | Laos | 0.0 /100 | #302 | Tragic 94.5% |
| Sri Lankans | 0.0 /100 | #303 | Tragic 94.4% |
| Immigrants | Haiti | 0.0 /100 | #304 | Tragic 94.3% |
| Guyanese | 0.0 /100 | #305 | Tragic 94.3% |
| Immigrants | Guyana | 0.0 /100 | #306 | Tragic 94.2% |
| Immigrants | Portugal | 0.0 /100 | #307 | Tragic 94.2% |
Demographics Similar to Immigrants from Egypt by 7th Grade
In terms of 7th grade, the demographic groups most similar to Immigrants from Egypt are Immigrants from Venezuela (95.9%, a difference of 0.0%), Immigrants from Iraq (96.0%, a difference of 0.010%), Immigrants from Uganda (96.0%, a difference of 0.010%), Immigrants from Micronesia (95.9%, a difference of 0.010%), and Liberian (95.9%, a difference of 0.010%).
| Demographics | Rating | Rank | 7th Grade |
| Pakistanis | 44.5 /100 | #181 | Average 96.0% |
| Iraqis | 41.2 /100 | #182 | Average 96.0% |
| Immigrants | Spain | 38.8 /100 | #183 | Fair 96.0% |
| Sierra Leoneans | 37.5 /100 | #184 | Fair 96.0% |
| Brazilians | 37.3 /100 | #185 | Fair 96.0% |
| Immigrants | Iraq | 36.1 /100 | #186 | Fair 96.0% |
| Immigrants | Uganda | 36.0 /100 | #187 | Fair 96.0% |
| Immigrants | Egypt | 34.3 /100 | #188 | Fair 95.9% |
| Immigrants | Venezuela | 33.9 /100 | #189 | Fair 95.9% |
| Immigrants | Micronesia | 32.6 /100 | #190 | Fair 95.9% |
| Liberians | 32.5 /100 | #191 | Fair 95.9% |
| Panamanians | 32.3 /100 | #192 | Fair 95.9% |
| Immigrants | Bahamas | 30.8 /100 | #193 | Fair 95.9% |
| Immigrants | Nepal | 30.0 /100 | #194 | Fair 95.9% |
| Sudanese | 28.1 /100 | #195 | Fair 95.9% |