Immigrants from Burma/Myanmar vs Immigrants from Afghanistan 4th Grade

COMPARE

Immigrants from Burma/Myanmar
Race
Ancestry
AfghanAfricanAlaska NativeAlaskan AthabascanAlbanianAleutAlsatianAmericanApacheArabArapahoArgentineanArmenianAssyrian/Chaldean/SyriacAustralianAustrianBahamianBangladeshiBarbadianBasqueBelgianBelizeanBermudanBhutaneseBlackfeetBolivianBrazilianBritishBritish West IndianBulgarianBurmeseCajunCambodianCanadianCape VerdeanCarpatho RusynCelticCentral AmericanCentral American IndianCherokeeCheyenneChickasawChileanChineseChippewaChoctawColombianColvilleComancheCosta RicanCreeCreekCroatianCrowCubanCypriotCzechCzechoslovakianDanishDelawareDominicanDutchDutch West IndianEastern EuropeanEcuadorianEgyptianEnglishEstonianEthiopianEuropeanFijianFilipinoFinnishFrenchFrench American IndianFrench CanadianGermanGerman RussianGhanaianGreekGuamanian/ChamorroGuatemalanGuyaneseHaitianHmongHonduranHopiHoumaHungarianIcelanderIndian (Asian)IndonesianInupiatIranianIraqiIrishIroquoisIsraeliItalianJamaicanJapaneseJordanianKenyanKiowaKoreanLaotianLatvianLebaneseLiberianLithuanianLumbeeLuxembourgerMacedonianMalaysianMalteseMarshalleseMenomineeMexicanMexican American IndianMongolianMoroccanNative HawaiianNavajoNepaleseNew ZealanderNicaraguanNigerianNorthern EuropeanNorwegianOkinawanOsageOttawaPaiutePakistaniPalestinianPanamanianParaguayanPennsylvania GermanPeruvianPimaPolishPortuguesePotawatomiPuebloPuerto RicanPuget Sound SalishRomanianRussianSalvadoranSamoanScandinavianScotch-IrishScottishSeminoleSenegaleseSerbianShoshoneSierra LeoneanSiouxSlavicSlovakSloveneSomaliSouth AfricanSouth AmericanSouth American IndianSoviet UnionSpaniardSpanishSpanish AmericanSpanish American IndianSri LankanSubsaharan AfricanSudaneseSwedishSwissSyrianTaiwaneseThaiTlingit-HaidaTohono O'OdhamTonganTrinidadian and TobagonianTsimshianTurkishU.S. Virgin IslanderUgandanUkrainianUruguayanUteVenezuelanVietnameseWelshWest IndianYakamaYaquiYugoslavianYumanYup'ikZimbabwean
Immigration
NonimmigrantsImmigrantsAfricaAlbaniaArgentinaArmeniaAsiaAustraliaAustriaBahamasBangladeshBarbadosBelarusBelgiumBelizeBoliviaBosnia and HerzegovinaBrazilBulgariaBurma/MyanmarCabo VerdeCambodiaCameroonCanadaCaribbeanCentral AmericaChileChinaColombiaCongoCosta RicaCroatiaCubaCzechoslovakiaDenmarkDominicaDominican RepublicEastern AfricaEastern AsiaEastern EuropeEcuadorEgyptEl SalvadorEnglandEritreaEthiopiaEuropeFijiFranceGermanyGhanaGreeceGrenadaGuatemalaGuyanaHaitiHondurasHong KongHungaryIndiaIndonesiaIranIraqIrelandIsraelItalyJamaicaJapanJordanKazakhstanKenyaKoreaKuwaitLaosLatin AmericaLatviaLebanonLiberiaLithuaniaMalaysiaMexicoMicronesiaMiddle AfricaMoldovaMoroccoNepalNetherlandsNicaraguaNigeriaNorth AmericaNorth MacedoniaNorthern AfricaNorthern EuropeNorwayOceaniaPakistanPanamaPeruPhilippinesPolandPortugalRomaniaRussiaSaudi ArabiaScotlandSenegalSerbiaSierra LeoneSingaporeSomaliaSouth AfricaSouth AmericaSouth Central AsiaSouth Eastern AsiaSouthern EuropeSpainSri LankaSt. Vincent and the GrenadinesSudanSwedenSwitzerlandSyriaTaiwanThailandTrinidad and TobagoTurkeyUgandaUkraineUruguayUzbekistanVenezuelaVietnamWest IndiesWestern AfricaWestern AsiaWestern EuropeYemenZaireZimbabweAzores
Immigrants from Afghanistan
Race
Ancestry
AfghanAfricanAlaska NativeAlaskan AthabascanAlbanianAleutAlsatianAmericanApacheArabArapahoArgentineanArmenianAssyrian/Chaldean/SyriacAustralianAustrianBahamianBangladeshiBarbadianBasqueBelgianBelizeanBermudanBhutaneseBlackfeetBolivianBrazilianBritishBritish West IndianBulgarianBurmeseCajunCambodianCanadianCape VerdeanCarpatho RusynCelticCentral AmericanCentral American IndianCherokeeCheyenneChickasawChileanChineseChippewaChoctawColombianColvilleComancheCosta RicanCreeCreekCroatianCrowCubanCypriotCzechCzechoslovakianDanishDelawareDominicanDutchDutch West IndianEastern EuropeanEcuadorianEgyptianEnglishEstonianEthiopianEuropeanFijianFilipinoFinnishFrenchFrench American IndianFrench CanadianGermanGerman RussianGhanaianGreekGuamanian/ChamorroGuatemalanGuyaneseHaitianHmongHonduranHopiHoumaHungarianIcelanderIndian (Asian)IndonesianInupiatIranianIraqiIrishIroquoisIsraeliItalianJamaicanJapaneseJordanianKenyanKiowaKoreanLaotianLatvianLebaneseLiberianLithuanianLumbeeLuxembourgerMacedonianMalaysianMalteseMarshalleseMenomineeMexicanMexican American IndianMongolianMoroccanNative HawaiianNavajoNepaleseNew ZealanderNicaraguanNigerianNorthern EuropeanNorwegianOkinawanOsageOttawaPaiutePakistaniPalestinianPanamanianParaguayanPennsylvania GermanPeruvianPimaPolishPortuguesePotawatomiPuebloPuerto RicanPuget Sound SalishRomanianRussianSalvadoranSamoanScandinavianScotch-IrishScottishSeminoleSenegaleseSerbianShoshoneSierra LeoneanSiouxSlavicSlovakSloveneSomaliSouth AfricanSouth AmericanSouth American IndianSoviet UnionSpaniardSpanishSpanish AmericanSpanish American IndianSri LankanSubsaharan AfricanSudaneseSwedishSwissSyrianTaiwaneseThaiTlingit-HaidaTohono O'OdhamTonganTrinidadian and TobagonianTsimshianTurkishU.S. Virgin IslanderUgandanUkrainianUruguayanUteVenezuelanVietnameseWelshWest IndianYakamaYaquiYugoslavianYumanYup'ikZimbabwean
Immigration
NonimmigrantsImmigrantsAfghanistanAfricaAlbaniaArgentinaArmeniaAsiaAustraliaAustriaBahamasBangladeshBarbadosBelarusBelgiumBelizeBoliviaBosnia and HerzegovinaBrazilBulgariaCabo VerdeCambodiaCameroonCanadaCaribbeanCentral AmericaChileChinaColombiaCongoCosta RicaCroatiaCubaCzechoslovakiaDenmarkDominicaDominican RepublicEastern AfricaEastern AsiaEastern EuropeEcuadorEgyptEl SalvadorEnglandEritreaEthiopiaEuropeFijiFranceGermanyGhanaGreeceGrenadaGuatemalaGuyanaHaitiHondurasHong KongHungaryIndiaIndonesiaIranIraqIrelandIsraelItalyJamaicaJapanJordanKazakhstanKenyaKoreaKuwaitLaosLatin AmericaLatviaLebanonLiberiaLithuaniaMalaysiaMexicoMicronesiaMiddle AfricaMoldovaMoroccoNepalNetherlandsNicaraguaNigeriaNorth AmericaNorth MacedoniaNorthern AfricaNorthern EuropeNorwayOceaniaPakistanPanamaPeruPhilippinesPolandPortugalRomaniaRussiaSaudi ArabiaScotlandSenegalSerbiaSierra LeoneSingaporeSomaliaSouth AfricaSouth AmericaSouth Central AsiaSouth Eastern AsiaSouthern EuropeSpainSri LankaSt. Vincent and the GrenadinesSudanSwedenSwitzerlandSyriaTaiwanThailandTrinidad and TobagoTurkeyUgandaUkraineUruguayUzbekistanVenezuelaVietnamWest IndiesWestern AfricaWestern AsiaWestern EuropeYemenZaireZimbabweAzores
4th Grade
Income
Poverty
Unemployment
Labor Participation
Family Structure
Vehicle Availability
Education Level
Disability

4th Grade Comparison

Immigrants from Burma/Myanmar

Immigrants from Afghanistan

Tragic
Tragic
96.3%
4TH GRADE
0.0/ 100
METRIC RATING
310th/ 347
METRIC RANK
96.8%
4TH GRADE
0.0/ 100
METRIC RATING
288th/ 347
METRIC RANK

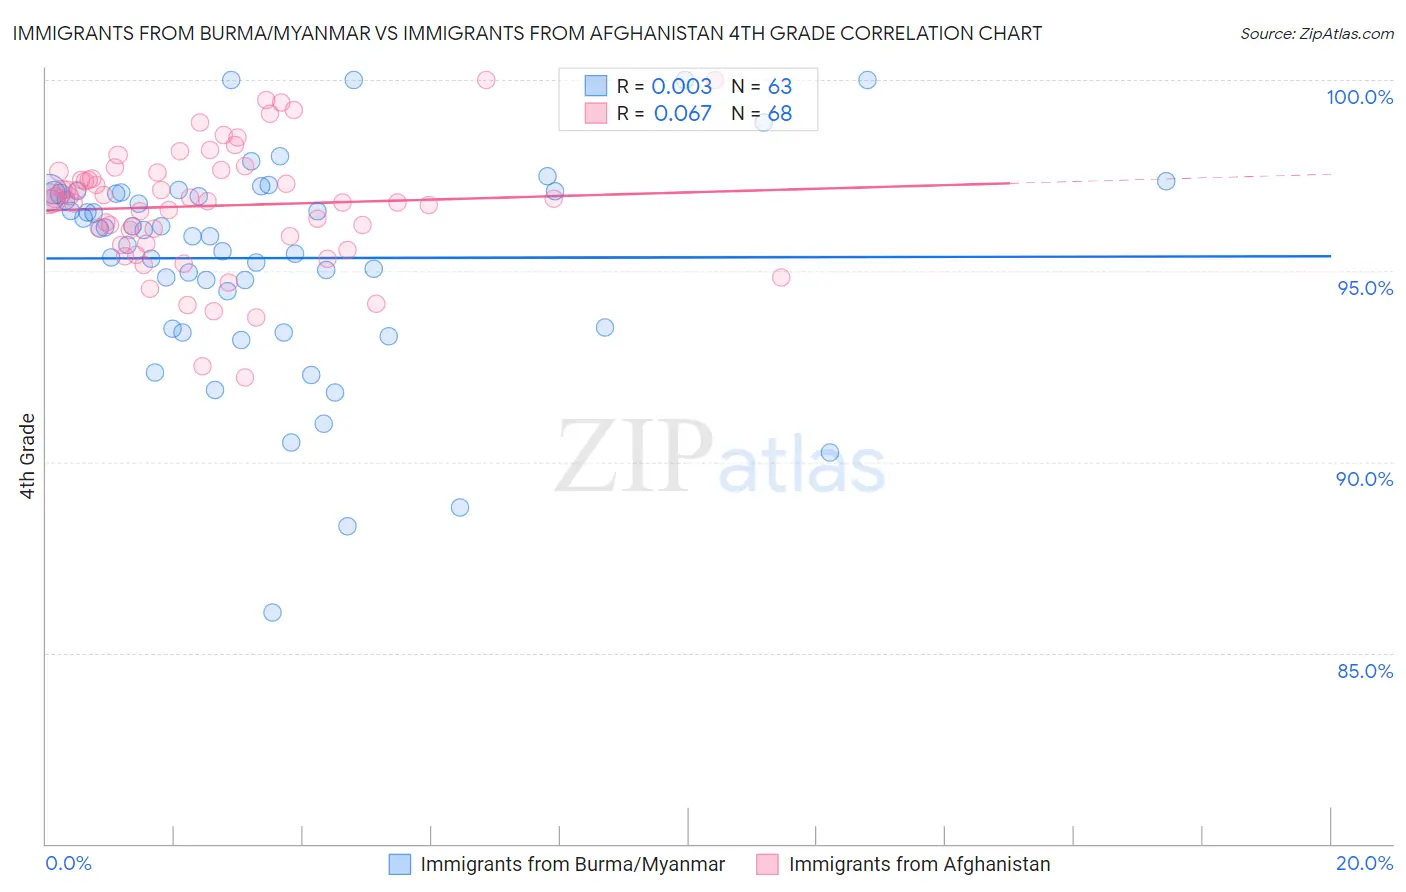
Immigrants from Burma/Myanmar vs Immigrants from Afghanistan 4th Grade Correlation Chart

The statistical analysis conducted on geographies consisting of 172,338,093 people shows no correlation between the proportion of Immigrants from Burma/Myanmar and percentage of population with at least 4th grade education in the United States with a correlation coefficient (R) of 0.003 and weighted average of 96.3%. Similarly, the statistical analysis conducted on geographies consisting of 147,629,924 people shows a slight positive correlation between the proportion of Immigrants from Afghanistan and percentage of population with at least 4th grade education in the United States with a correlation coefficient (R) of 0.067 and weighted average of 96.8%, a difference of 0.49%.
Immigrants from Burma/Myanmar vs Immigrants from Afghanistan 4th Grade

4th Grade Correlation Summary

MeasurementImmigrants from Burma/MyanmarImmigrants from Afghanistan
Minimum86.0%92.2%
Maximum100.0%100.0%
Range14.0%7.8%
Mean95.3%96.7%
Median96.1%96.9%
Interquartile 25% (IQ1)93.5%95.8%
Interquartile 75% (IQ3)97.1%97.6%
Interquartile Range (IQR)3.6%1.8%
Standard Deviation (Sample)2.8%1.6%
Standard Deviation (Population)2.8%1.6%

Similar Demographics by 4th Grade

Demographics Similar to Immigrants from Burma/Myanmar by 4th Grade

In terms of 4th grade, the demographic groups most similar to Immigrants from Burma/Myanmar are Immigrants from Guyana (96.3%, a difference of 0.020%), Immigrants from Laos (96.3%, a difference of 0.030%), Immigrants from Haiti (96.3%, a difference of 0.040%), Immigrants from Bangladesh (96.2%, a difference of 0.050%), and Cape Verdean (96.2%, a difference of 0.050%).
DemographicsRating | Rank4th Grade
Guyanese
0.0
/100
|
#303
Tragic
96.4%
Ecuadorians
0.0
/100
|
#304
Tragic
96.4%
Immigrants | Caribbean
0.0
/100
|
#305
Tragic
96.4%
Sri Lankans
0.0
/100
|
#306
Tragic
96.4%
Immigrants | Haiti
0.0
/100
|
#307
Tragic
96.3%
Immigrants | Laos
0.0
/100
|
#308
Tragic
96.3%
Immigrants | Guyana
0.0
/100
|
#309
Tragic
96.3%
Immigrants | Burma/Myanmar
0.0
/100
|
#310
Tragic
96.3%
Immigrants | Bangladesh
0.0
/100
|
#311
Tragic
96.2%
Cape Verdeans
0.0
/100
|
#312
Tragic
96.2%
Indonesians
0.0
/100
|
#313
Tragic
96.2%
Vietnamese
0.0
/100
|
#314
Tragic
96.2%
Nicaraguans
0.0
/100
|
#315
Tragic
96.2%
Immigrants | Ecuador
0.0
/100
|
#316
Tragic
96.2%
Central American Indians
0.0
/100
|
#317
Tragic
96.2%

Demographics Similar to Immigrants from Afghanistan by 4th Grade

In terms of 4th grade, the demographic groups most similar to Immigrants from Afghanistan are Houma (96.8%, a difference of 0.0%), Immigrants from West Indies (96.7%, a difference of 0.020%), British West Indian (96.7%, a difference of 0.030%), Immigrants from Barbados (96.8%, a difference of 0.040%), and Immigrants from Thailand (96.8%, a difference of 0.040%).
DemographicsRating | Rank4th Grade
Immigrants | Hong Kong
0.1
/100
|
#281
Tragic
96.9%
Immigrants | Trinidad and Tobago
0.1
/100
|
#282
Tragic
96.8%
Immigrants | Philippines
0.1
/100
|
#283
Tragic
96.8%
Immigrants | St. Vincent and the Grenadines
0.1
/100
|
#284
Tragic
96.8%
Immigrants | Barbados
0.0
/100
|
#285
Tragic
96.8%
Immigrants | Thailand
0.0
/100
|
#286
Tragic
96.8%
Houma
0.0
/100
|
#287
Tragic
96.8%
Immigrants | Afghanistan
0.0
/100
|
#288
Tragic
96.8%
Immigrants | West Indies
0.0
/100
|
#289
Tragic
96.7%
British West Indians
0.0
/100
|
#290
Tragic
96.7%
Immigrants | Grenada
0.0
/100
|
#291
Tragic
96.7%
Malaysians
0.0
/100
|
#292
Tragic
96.7%
Puerto Ricans
0.0
/100
|
#293
Tragic
96.7%
Immigrants | Eritrea
0.0
/100
|
#294
Tragic
96.7%
Immigrants | Portugal
0.0
/100
|
#295
Tragic
96.6%