Immigrants from Burma/Myanmar vs Immigrants from Middle Africa 4th Grade
COMPARE
Immigrants from Burma/Myanmar
Immigrants from Middle Africa
4th Grade
4th Grade Comparison
Immigrants from Burma/Myanmar
Immigrants from Middle Africa
96.3%
4TH GRADE
0.0/ 100
METRIC RATING
310th/ 347
METRIC RANK
97.1%
4TH GRADE
0.8/ 100
METRIC RATING
254th/ 347
METRIC RANK
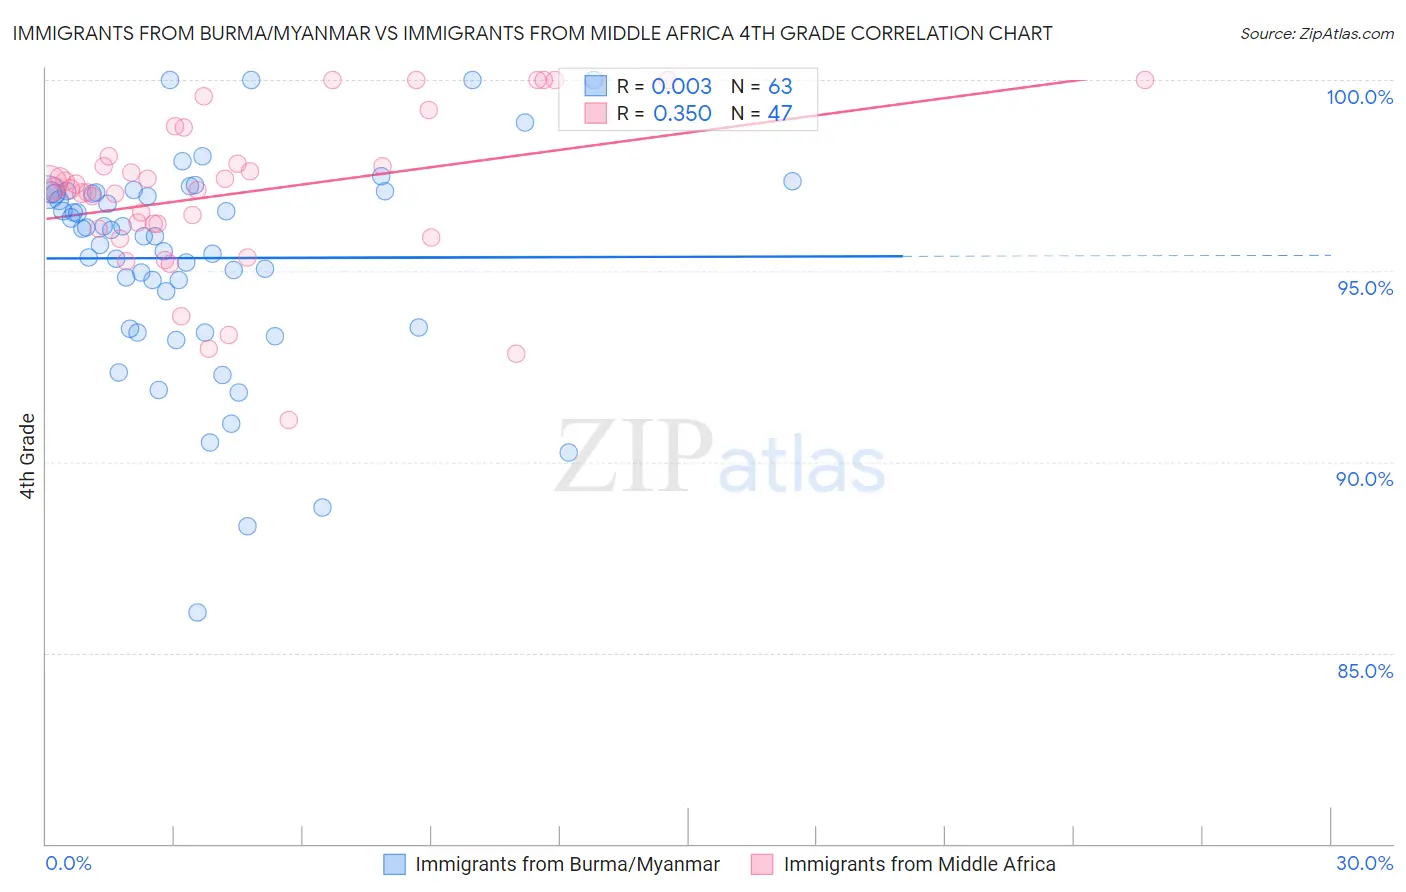
Immigrants from Burma/Myanmar vs Immigrants from Middle Africa 4th Grade Correlation Chart
The statistical analysis conducted on geographies consisting of 172,338,093 people shows no correlation between the proportion of Immigrants from Burma/Myanmar and percentage of population with at least 4th grade education in the United States with a correlation coefficient (R) of 0.003 and weighted average of 96.3%. Similarly, the statistical analysis conducted on geographies consisting of 202,721,852 people shows a mild positive correlation between the proportion of Immigrants from Middle Africa and percentage of population with at least 4th grade education in the United States with a correlation coefficient (R) of 0.350 and weighted average of 97.1%, a difference of 0.82%.
4th Grade Correlation Summary
| Measurement | Immigrants from Burma/Myanmar | Immigrants from Middle Africa |
| Minimum | 86.0% | 91.1% |
| Maximum | 100.0% | 100.0% |
| Range | 14.0% | 8.9% |
| Mean | 95.3% | 97.0% |
| Median | 96.1% | 97.2% |
| Interquartile 25% (IQ1) | 93.5% | 96.1% |
| Interquartile 75% (IQ3) | 97.1% | 98.0% |
| Interquartile Range (IQR) | 3.6% | 1.9% |
| Standard Deviation (Sample) | 2.8% | 2.1% |
| Standard Deviation (Population) | 2.8% | 2.0% |
Similar Demographics by 4th Grade
Demographics Similar to Immigrants from Burma/Myanmar by 4th Grade
In terms of 4th grade, the demographic groups most similar to Immigrants from Burma/Myanmar are Immigrants from Guyana (96.3%, a difference of 0.020%), Immigrants from Laos (96.3%, a difference of 0.030%), Immigrants from Haiti (96.3%, a difference of 0.040%), Immigrants from Bangladesh (96.2%, a difference of 0.050%), and Cape Verdean (96.2%, a difference of 0.050%).
| Demographics | Rating | Rank | 4th Grade |
| Guyanese | 0.0 /100 | #303 | Tragic 96.4% |
| Ecuadorians | 0.0 /100 | #304 | Tragic 96.4% |
| Immigrants | Caribbean | 0.0 /100 | #305 | Tragic 96.4% |
| Sri Lankans | 0.0 /100 | #306 | Tragic 96.4% |
| Immigrants | Haiti | 0.0 /100 | #307 | Tragic 96.3% |
| Immigrants | Laos | 0.0 /100 | #308 | Tragic 96.3% |
| Immigrants | Guyana | 0.0 /100 | #309 | Tragic 96.3% |
| Immigrants | Burma/Myanmar | 0.0 /100 | #310 | Tragic 96.3% |
| Immigrants | Bangladesh | 0.0 /100 | #311 | Tragic 96.2% |
| Cape Verdeans | 0.0 /100 | #312 | Tragic 96.2% |
| Indonesians | 0.0 /100 | #313 | Tragic 96.2% |
| Vietnamese | 0.0 /100 | #314 | Tragic 96.2% |
| Nicaraguans | 0.0 /100 | #315 | Tragic 96.2% |
| Immigrants | Ecuador | 0.0 /100 | #316 | Tragic 96.2% |
| Central American Indians | 0.0 /100 | #317 | Tragic 96.2% |
Demographics Similar to Immigrants from Middle Africa by 4th Grade
In terms of 4th grade, the demographic groups most similar to Immigrants from Middle Africa are South American (97.1%, a difference of 0.0%), Jamaican (97.1%, a difference of 0.0%), Immigrants from Liberia (97.1%, a difference of 0.0%), Immigrants from Senegal (97.1%, a difference of 0.010%), and Peruvian (97.1%, a difference of 0.010%).
| Demographics | Rating | Rank | 4th Grade |
| Ethiopians | 1.2 /100 | #247 | Tragic 97.1% |
| Immigrants | Asia | 1.2 /100 | #248 | Tragic 97.1% |
| Immigrants | Africa | 1.0 /100 | #249 | Tragic 97.1% |
| Immigrants | Senegal | 0.9 /100 | #250 | Tragic 97.1% |
| South Americans | 0.8 /100 | #251 | Tragic 97.1% |
| Jamaicans | 0.8 /100 | #252 | Tragic 97.1% |
| Immigrants | Liberia | 0.8 /100 | #253 | Tragic 97.1% |
| Immigrants | Middle Africa | 0.8 /100 | #254 | Tragic 97.1% |
| Peruvians | 0.7 /100 | #255 | Tragic 97.1% |
| Bolivians | 0.7 /100 | #256 | Tragic 97.1% |
| Immigrants | Congo | 0.5 /100 | #257 | Tragic 97.0% |
| Immigrants | Colombia | 0.5 /100 | #258 | Tragic 97.0% |
| Immigrants | Ethiopia | 0.4 /100 | #259 | Tragic 97.0% |
| Immigrants | Sierra Leone | 0.4 /100 | #260 | Tragic 97.0% |
| Immigrants | South America | 0.4 /100 | #261 | Tragic 97.0% |