Immigrants from Bulgaria vs Bhutanese 3rd Grade
COMPARE
Immigrants from Bulgaria
Bhutanese
3rd Grade
3rd Grade Comparison
Immigrants from Bulgaria
Bhutanese
97.9%
3RD GRADE
89.1/ 100
METRIC RATING
131st/ 347
METRIC RANK
98.1%
3RD GRADE
97.2/ 100
METRIC RATING
106th/ 347
METRIC RANK
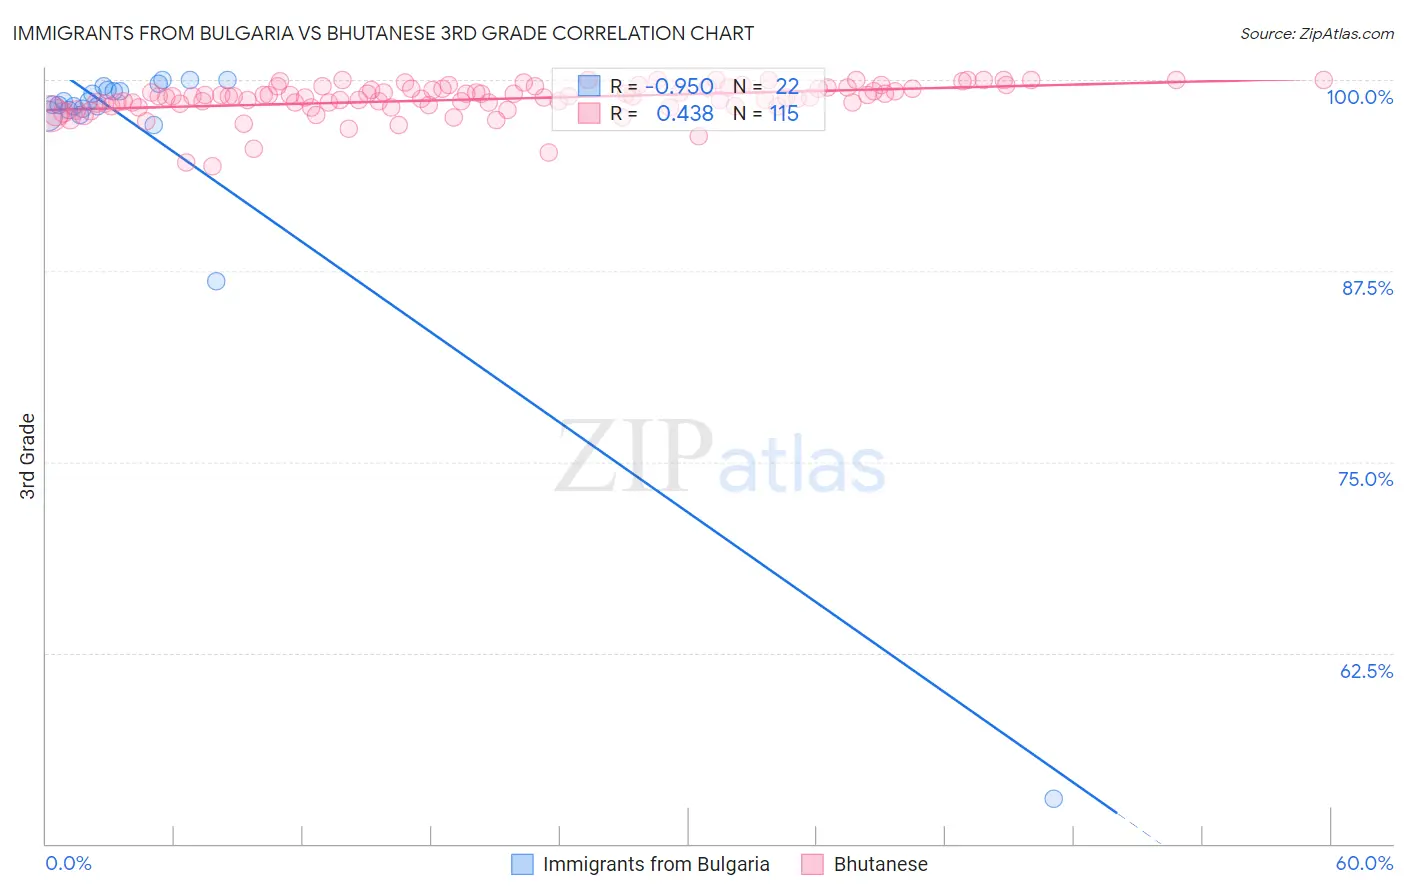
Immigrants from Bulgaria vs Bhutanese 3rd Grade Correlation Chart
The statistical analysis conducted on geographies consisting of 172,552,181 people shows a perfect negative correlation between the proportion of Immigrants from Bulgaria and percentage of population with at least 3rd grade education in the United States with a correlation coefficient (R) of -0.950 and weighted average of 97.9%. Similarly, the statistical analysis conducted on geographies consisting of 455,590,842 people shows a moderate positive correlation between the proportion of Bhutanese and percentage of population with at least 3rd grade education in the United States with a correlation coefficient (R) of 0.438 and weighted average of 98.1%, a difference of 0.12%.
3rd Grade Correlation Summary
| Measurement | Immigrants from Bulgaria | Bhutanese |
| Minimum | 52.9% | 94.4% |
| Maximum | 100.0% | 100.0% |
| Range | 47.1% | 5.6% |
| Mean | 96.1% | 98.7% |
| Median | 98.5% | 98.9% |
| Interquartile 25% (IQ1) | 98.1% | 98.4% |
| Interquartile 75% (IQ3) | 99.4% | 99.5% |
| Interquartile Range (IQR) | 1.3% | 1.1% |
| Standard Deviation (Sample) | 10.0% | 1.1% |
| Standard Deviation (Population) | 9.8% | 1.1% |
Similar Demographics by 3rd Grade
Demographics Similar to Immigrants from Bulgaria by 3rd Grade
In terms of 3rd grade, the demographic groups most similar to Immigrants from Bulgaria are Immigrants from Hungary (97.9%, a difference of 0.0%), Immigrants from Kuwait (97.9%, a difference of 0.0%), Seminole (97.9%, a difference of 0.0%), Cambodian (97.9%, a difference of 0.010%), and Spaniard (97.9%, a difference of 0.010%).
| Demographics | Rating | Rank | 3rd Grade |
| Immigrants | Japan | 93.7 /100 | #124 | Exceptional 98.0% |
| Immigrants | Saudi Arabia | 93.5 /100 | #125 | Exceptional 98.0% |
| Immigrants | Zimbabwe | 93.4 /100 | #126 | Exceptional 98.0% |
| Ute | 93.2 /100 | #127 | Exceptional 98.0% |
| Colville | 92.1 /100 | #128 | Exceptional 98.0% |
| Immigrants | Serbia | 91.9 /100 | #129 | Exceptional 98.0% |
| Immigrants | Europe | 91.2 /100 | #130 | Exceptional 98.0% |
| Immigrants | Bulgaria | 89.1 /100 | #131 | Excellent 97.9% |
| Immigrants | Hungary | 88.8 /100 | #132 | Excellent 97.9% |
| Immigrants | Kuwait | 88.7 /100 | #133 | Excellent 97.9% |
| Seminole | 88.7 /100 | #134 | Excellent 97.9% |
| Cambodians | 88.1 /100 | #135 | Excellent 97.9% |
| Spaniards | 87.9 /100 | #136 | Excellent 97.9% |
| Immigrants | Romania | 87.9 /100 | #137 | Excellent 97.9% |
| Israelis | 86.6 /100 | #138 | Excellent 97.9% |
Demographics Similar to Bhutanese by 3rd Grade
In terms of 3rd grade, the demographic groups most similar to Bhutanese are German Russian (98.1%, a difference of 0.0%), Turkish (98.1%, a difference of 0.010%), Immigrants from Czechoslovakia (98.0%, a difference of 0.010%), Immigrants from Singapore (98.0%, a difference of 0.010%), and Pima (98.0%, a difference of 0.010%).
| Demographics | Rating | Rank | 3rd Grade |
| Romanians | 98.0 /100 | #99 | Exceptional 98.1% |
| Cree | 97.9 /100 | #100 | Exceptional 98.1% |
| Puget Sound Salish | 97.9 /100 | #101 | Exceptional 98.1% |
| Immigrants | Nonimmigrants | 97.8 /100 | #102 | Exceptional 98.1% |
| Yugoslavians | 97.7 /100 | #103 | Exceptional 98.1% |
| Turks | 97.6 /100 | #104 | Exceptional 98.1% |
| German Russians | 97.2 /100 | #105 | Exceptional 98.1% |
| Bhutanese | 97.2 /100 | #106 | Exceptional 98.1% |
| Immigrants | Czechoslovakia | 97.0 /100 | #107 | Exceptional 98.0% |
| Immigrants | Singapore | 96.7 /100 | #108 | Exceptional 98.0% |
| Pima | 96.7 /100 | #109 | Exceptional 98.0% |
| Immigrants | Switzerland | 96.6 /100 | #110 | Exceptional 98.0% |
| Basques | 96.5 /100 | #111 | Exceptional 98.0% |
| Immigrants | Latvia | 96.0 /100 | #112 | Exceptional 98.0% |
| Thais | 95.5 /100 | #113 | Exceptional 98.0% |