Fijian vs Scotch-Irish 3rd Grade
COMPARE
Fijian
Scotch-Irish
3rd Grade
3rd Grade Comparison
Fijians
Scotch-Irish
97.3%
3RD GRADE
0.2/ 100
METRIC RATING
269th/ 347
METRIC RANK
98.5%
3RD GRADE
100.0/ 100
METRIC RATING
25th/ 347
METRIC RANK
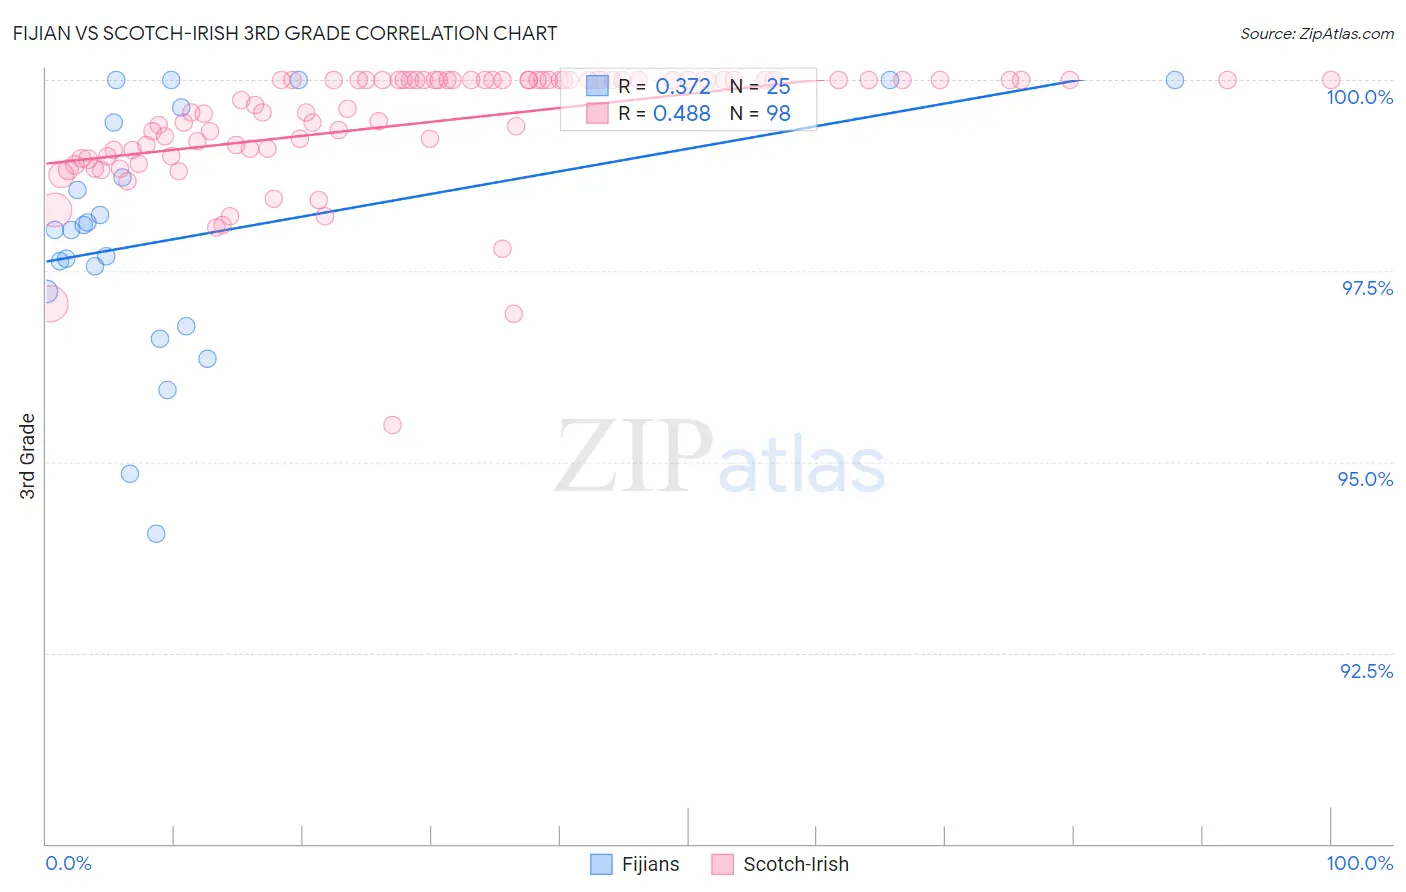
Fijian vs Scotch-Irish 3rd Grade Correlation Chart
The statistical analysis conducted on geographies consisting of 55,948,842 people shows a mild positive correlation between the proportion of Fijians and percentage of population with at least 3rd grade education in the United States with a correlation coefficient (R) of 0.372 and weighted average of 97.3%. Similarly, the statistical analysis conducted on geographies consisting of 548,777,407 people shows a moderate positive correlation between the proportion of Scotch-Irish and percentage of population with at least 3rd grade education in the United States with a correlation coefficient (R) of 0.488 and weighted average of 98.5%, a difference of 1.3%.
3rd Grade Correlation Summary
| Measurement | Fijian | Scotch-Irish |
| Minimum | 94.1% | 95.5% |
| Maximum | 100.0% | 100.0% |
| Range | 5.9% | 4.5% |
| Mean | 98.0% | 99.4% |
| Median | 98.0% | 99.9% |
| Interquartile 25% (IQ1) | 97.0% | 99.1% |
| Interquartile 75% (IQ3) | 99.5% | 100.0% |
| Interquartile Range (IQR) | 2.5% | 0.92% |
| Standard Deviation (Sample) | 1.6% | 0.79% |
| Standard Deviation (Population) | 1.6% | 0.79% |
Similar Demographics by 3rd Grade
Demographics Similar to Fijians by 3rd Grade
In terms of 3rd grade, the demographic groups most similar to Fijians are Cuban (97.3%, a difference of 0.0%), Yaqui (97.3%, a difference of 0.010%), Immigrants from Nigeria (97.3%, a difference of 0.010%), Immigrants from Jamaica (97.3%, a difference of 0.020%), and Taiwanese (97.3%, a difference of 0.030%).
| Demographics | Rating | Rank | 3rd Grade |
| Immigrants | Sierra Leone | 0.4 /100 | #262 | Tragic 97.3% |
| Taiwanese | 0.3 /100 | #263 | Tragic 97.3% |
| West Indians | 0.3 /100 | #264 | Tragic 97.3% |
| Immigrants | Jamaica | 0.3 /100 | #265 | Tragic 97.3% |
| Yaqui | 0.3 /100 | #266 | Tragic 97.3% |
| Immigrants | Nigeria | 0.3 /100 | #267 | Tragic 97.3% |
| Cubans | 0.2 /100 | #268 | Tragic 97.3% |
| Fijians | 0.2 /100 | #269 | Tragic 97.3% |
| Immigrants | China | 0.2 /100 | #270 | Tragic 97.2% |
| Puerto Ricans | 0.2 /100 | #271 | Tragic 97.2% |
| Ghanaians | 0.1 /100 | #272 | Tragic 97.2% |
| Immigrants | Peru | 0.1 /100 | #273 | Tragic 97.2% |
| Immigrants | Cameroon | 0.1 /100 | #274 | Tragic 97.2% |
| Immigrants | Uzbekistan | 0.1 /100 | #275 | Tragic 97.2% |
| Immigrants | Bolivia | 0.1 /100 | #276 | Tragic 97.2% |
Demographics Similar to Scotch-Irish by 3rd Grade
In terms of 3rd grade, the demographic groups most similar to Scotch-Irish are Danish (98.5%, a difference of 0.0%), Lithuanian (98.5%, a difference of 0.010%), Finnish (98.5%, a difference of 0.010%), Sioux (98.5%, a difference of 0.010%), and Aleut (98.5%, a difference of 0.010%).
| Demographics | Rating | Rank | 3rd Grade |
| Irish | 100.0 /100 | #18 | Exceptional 98.5% |
| Poles | 100.0 /100 | #19 | Exceptional 98.5% |
| Pennsylvania Germans | 100.0 /100 | #20 | Exceptional 98.5% |
| Lithuanians | 100.0 /100 | #21 | Exceptional 98.5% |
| Finns | 100.0 /100 | #22 | Exceptional 98.5% |
| Sioux | 100.0 /100 | #23 | Exceptional 98.5% |
| Danes | 100.0 /100 | #24 | Exceptional 98.5% |
| Scotch-Irish | 100.0 /100 | #25 | Exceptional 98.5% |
| Aleuts | 100.0 /100 | #26 | Exceptional 98.5% |
| Croatians | 100.0 /100 | #27 | Exceptional 98.5% |
| French | 100.0 /100 | #28 | Exceptional 98.4% |
| French Canadians | 100.0 /100 | #29 | Exceptional 98.4% |
| Europeans | 100.0 /100 | #30 | Exceptional 98.4% |
| Czechs | 100.0 /100 | #31 | Exceptional 98.4% |
| Scandinavians | 100.0 /100 | #32 | Exceptional 98.4% |