Cape Verdean vs Scotch-Irish 3rd Grade
COMPARE
Cape Verdean
Scotch-Irish
3rd Grade
3rd Grade Comparison
Cape Verdeans
Scotch-Irish
96.6%
3RD GRADE
0.0/ 100
METRIC RATING
310th/ 347
METRIC RANK
98.5%
3RD GRADE
100.0/ 100
METRIC RATING
25th/ 347
METRIC RANK
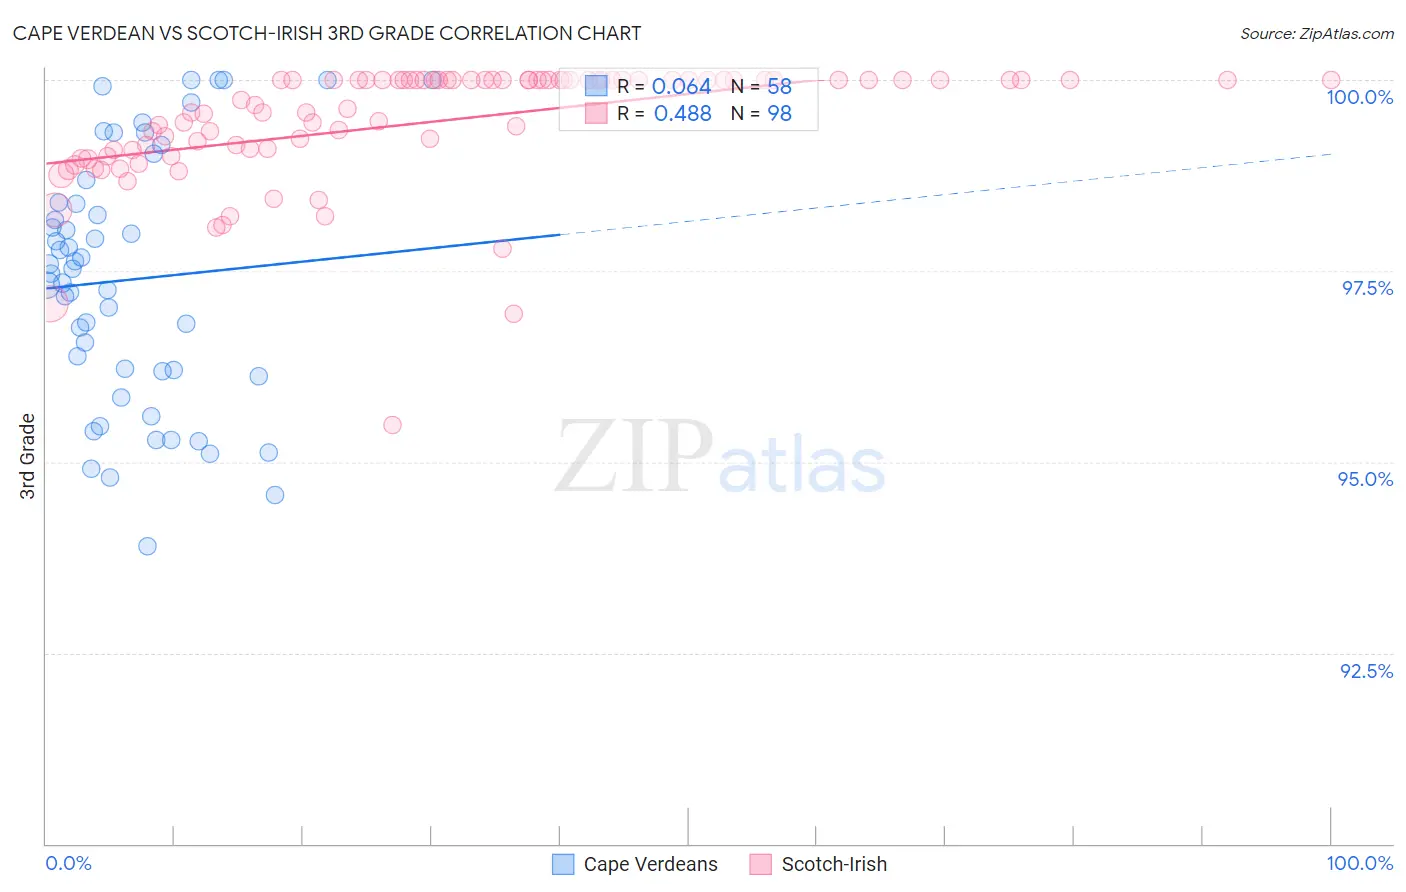
Cape Verdean vs Scotch-Irish 3rd Grade Correlation Chart
The statistical analysis conducted on geographies consisting of 107,537,955 people shows a slight positive correlation between the proportion of Cape Verdeans and percentage of population with at least 3rd grade education in the United States with a correlation coefficient (R) of 0.064 and weighted average of 96.6%. Similarly, the statistical analysis conducted on geographies consisting of 548,777,407 people shows a moderate positive correlation between the proportion of Scotch-Irish and percentage of population with at least 3rd grade education in the United States with a correlation coefficient (R) of 0.488 and weighted average of 98.5%, a difference of 1.9%.
3rd Grade Correlation Summary
| Measurement | Cape Verdean | Scotch-Irish |
| Minimum | 93.9% | 95.5% |
| Maximum | 100.0% | 100.0% |
| Range | 6.1% | 4.5% |
| Mean | 97.4% | 99.4% |
| Median | 97.5% | 99.9% |
| Interquartile 25% (IQ1) | 96.2% | 99.1% |
| Interquartile 75% (IQ3) | 98.4% | 100.0% |
| Interquartile Range (IQR) | 2.2% | 0.92% |
| Standard Deviation (Sample) | 1.6% | 0.79% |
| Standard Deviation (Population) | 1.6% | 0.79% |
Similar Demographics by 3rd Grade
Demographics Similar to Cape Verdeans by 3rd Grade
In terms of 3rd grade, the demographic groups most similar to Cape Verdeans are Nicaraguan (96.7%, a difference of 0.030%), Immigrants from Haiti (96.7%, a difference of 0.030%), Sri Lankan (96.7%, a difference of 0.030%), Immigrants from Guyana (96.6%, a difference of 0.030%), and Immigrants from Laos (96.6%, a difference of 0.040%).
| Demographics | Rating | Rank | 3rd Grade |
| Ecuadorians | 0.0 /100 | #303 | Tragic 96.7% |
| Immigrants | Caribbean | 0.0 /100 | #304 | Tragic 96.7% |
| Central American Indians | 0.0 /100 | #305 | Tragic 96.7% |
| Guyanese | 0.0 /100 | #306 | Tragic 96.7% |
| Nicaraguans | 0.0 /100 | #307 | Tragic 96.7% |
| Immigrants | Haiti | 0.0 /100 | #308 | Tragic 96.7% |
| Sri Lankans | 0.0 /100 | #309 | Tragic 96.7% |
| Cape Verdeans | 0.0 /100 | #310 | Tragic 96.6% |
| Immigrants | Guyana | 0.0 /100 | #311 | Tragic 96.6% |
| Immigrants | Laos | 0.0 /100 | #312 | Tragic 96.6% |
| Immigrants | Ecuador | 0.0 /100 | #313 | Tragic 96.6% |
| Belizeans | 0.0 /100 | #314 | Tragic 96.6% |
| Immigrants | Azores | 0.0 /100 | #315 | Tragic 96.6% |
| Immigrants | Burma/Myanmar | 0.0 /100 | #316 | Tragic 96.6% |
| Immigrants | Bangladesh | 0.0 /100 | #317 | Tragic 96.6% |
Demographics Similar to Scotch-Irish by 3rd Grade
In terms of 3rd grade, the demographic groups most similar to Scotch-Irish are Danish (98.5%, a difference of 0.0%), Lithuanian (98.5%, a difference of 0.010%), Finnish (98.5%, a difference of 0.010%), Sioux (98.5%, a difference of 0.010%), and Aleut (98.5%, a difference of 0.010%).
| Demographics | Rating | Rank | 3rd Grade |
| Irish | 100.0 /100 | #18 | Exceptional 98.5% |
| Poles | 100.0 /100 | #19 | Exceptional 98.5% |
| Pennsylvania Germans | 100.0 /100 | #20 | Exceptional 98.5% |
| Lithuanians | 100.0 /100 | #21 | Exceptional 98.5% |
| Finns | 100.0 /100 | #22 | Exceptional 98.5% |
| Sioux | 100.0 /100 | #23 | Exceptional 98.5% |
| Danes | 100.0 /100 | #24 | Exceptional 98.5% |
| Scotch-Irish | 100.0 /100 | #25 | Exceptional 98.5% |
| Aleuts | 100.0 /100 | #26 | Exceptional 98.5% |
| Croatians | 100.0 /100 | #27 | Exceptional 98.5% |
| French | 100.0 /100 | #28 | Exceptional 98.4% |
| French Canadians | 100.0 /100 | #29 | Exceptional 98.4% |
| Europeans | 100.0 /100 | #30 | Exceptional 98.4% |
| Czechs | 100.0 /100 | #31 | Exceptional 98.4% |
| Scandinavians | 100.0 /100 | #32 | Exceptional 98.4% |