Immigrants from Brazil vs Ukrainian Disability Age 65 to 74
COMPARE
Immigrants from Brazil
Ukrainian
Disability Age 65 to 74
Disability Age 65 to 74 Comparison
Immigrants from Brazil
Ukrainians
21.9%
DISABILITY AGE 65 TO 74
98.5/ 100
METRIC RATING
83rd/ 347
METRIC RANK
22.3%
DISABILITY AGE 65 TO 74
95.1/ 100
METRIC RATING
114th/ 347
METRIC RANK
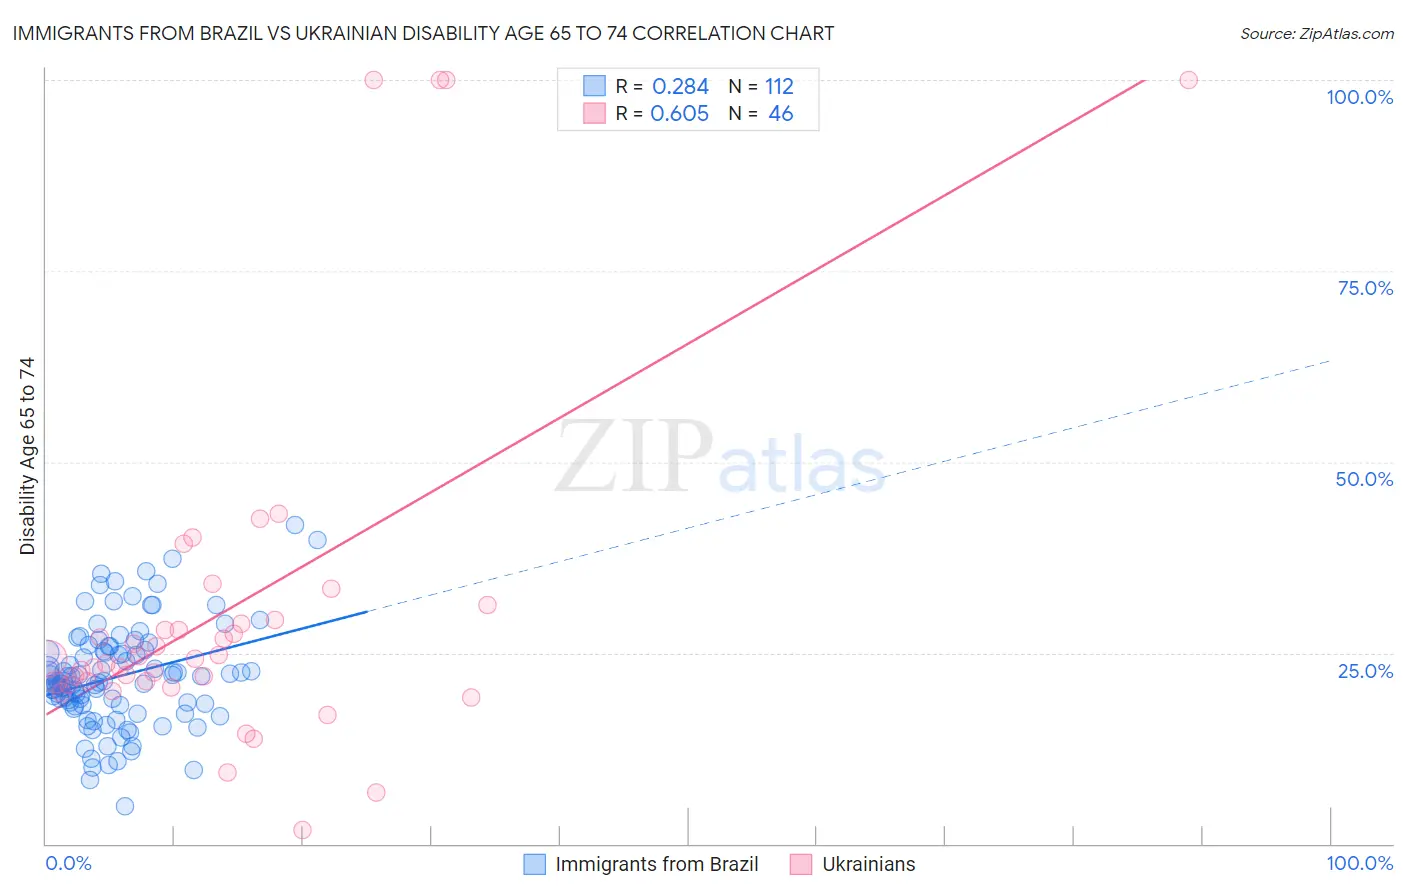
Immigrants from Brazil vs Ukrainian Disability Age 65 to 74 Correlation Chart
The statistical analysis conducted on geographies consisting of 342,588,968 people shows a weak positive correlation between the proportion of Immigrants from Brazil and percentage of population with a disability between the ages 65 and 75 in the United States with a correlation coefficient (R) of 0.284 and weighted average of 21.9%. Similarly, the statistical analysis conducted on geographies consisting of 447,594,992 people shows a significant positive correlation between the proportion of Ukrainians and percentage of population with a disability between the ages 65 and 75 in the United States with a correlation coefficient (R) of 0.605 and weighted average of 22.3%, a difference of 1.9%.
Disability Age 65 to 74 Correlation Summary
| Measurement | Immigrants from Brazil | Ukrainian |
| Minimum | 4.9% | 1.9% |
| Maximum | 41.7% | 100.0% |
| Range | 36.8% | 98.1% |
| Mean | 21.9% | 30.8% |
| Median | 21.2% | 24.2% |
| Interquartile 25% (IQ1) | 18.1% | 21.2% |
| Interquartile 75% (IQ3) | 25.3% | 29.3% |
| Interquartile Range (IQR) | 7.2% | 8.1% |
| Standard Deviation (Sample) | 6.7% | 23.1% |
| Standard Deviation (Population) | 6.7% | 22.8% |
Similar Demographics by Disability Age 65 to 74
Demographics Similar to Immigrants from Brazil by Disability Age 65 to 74
In terms of disability age 65 to 74, the demographic groups most similar to Immigrants from Brazil are Immigrants from Spain (21.9%, a difference of 0.020%), Immigrants from Lebanon (21.9%, a difference of 0.12%), Immigrants from Indonesia (21.9%, a difference of 0.17%), South African (21.9%, a difference of 0.20%), and Croatian (21.8%, a difference of 0.43%).
| Demographics | Rating | Rank | Disability Age 65 to 74 |
| Greeks | 99.0 /100 | #76 | Exceptional 21.8% |
| Immigrants | Poland | 99.0 /100 | #77 | Exceptional 21.8% |
| Immigrants | Eastern Europe | 99.0 /100 | #78 | Exceptional 21.8% |
| Venezuelans | 99.0 /100 | #79 | Exceptional 21.8% |
| Immigrants | Norway | 98.9 /100 | #80 | Exceptional 21.8% |
| Croatians | 98.9 /100 | #81 | Exceptional 21.8% |
| Immigrants | Indonesia | 98.7 /100 | #82 | Exceptional 21.9% |
| Immigrants | Brazil | 98.5 /100 | #83 | Exceptional 21.9% |
| Immigrants | Spain | 98.5 /100 | #84 | Exceptional 21.9% |
| Immigrants | Lebanon | 98.4 /100 | #85 | Exceptional 21.9% |
| South Africans | 98.4 /100 | #86 | Exceptional 21.9% |
| Australians | 98.0 /100 | #87 | Exceptional 22.0% |
| Immigrants | Netherlands | 97.9 /100 | #88 | Exceptional 22.0% |
| Immigrants | Kuwait | 97.9 /100 | #89 | Exceptional 22.0% |
| Italians | 97.9 /100 | #90 | Exceptional 22.0% |
Demographics Similar to Ukrainians by Disability Age 65 to 74
In terms of disability age 65 to 74, the demographic groups most similar to Ukrainians are Laotian (22.3%, a difference of 0.060%), Syrian (22.3%, a difference of 0.080%), Brazilian (22.4%, a difference of 0.10%), Swedish (22.4%, a difference of 0.12%), and Austrian (22.4%, a difference of 0.12%).
| Demographics | Rating | Rank | Disability Age 65 to 74 |
| Slovenes | 96.1 /100 | #107 | Exceptional 22.2% |
| Immigrants | Zimbabwe | 96.1 /100 | #108 | Exceptional 22.3% |
| Albanians | 95.8 /100 | #109 | Exceptional 22.3% |
| Immigrants | Peru | 95.7 /100 | #110 | Exceptional 22.3% |
| Serbians | 95.7 /100 | #111 | Exceptional 22.3% |
| Immigrants | South America | 95.5 /100 | #112 | Exceptional 22.3% |
| Syrians | 95.3 /100 | #113 | Exceptional 22.3% |
| Ukrainians | 95.1 /100 | #114 | Exceptional 22.3% |
| Laotians | 94.9 /100 | #115 | Exceptional 22.3% |
| Brazilians | 94.8 /100 | #116 | Exceptional 22.4% |
| Swedes | 94.7 /100 | #117 | Exceptional 22.4% |
| Austrians | 94.7 /100 | #118 | Exceptional 22.4% |
| Immigrants | Northern Africa | 94.7 /100 | #119 | Exceptional 22.4% |
| Immigrants | Kazakhstan | 93.9 /100 | #120 | Exceptional 22.4% |
| Czechs | 93.5 /100 | #121 | Exceptional 22.4% |