Immigrants from Brazil vs Immigrants from Czechoslovakia 6th Grade
COMPARE
Immigrants from Brazil
Immigrants from Czechoslovakia
6th Grade
6th Grade Comparison
Immigrants from Brazil
Immigrants from Czechoslovakia
96.9%
6TH GRADE
25.5/ 100
METRIC RATING
195th/ 347
METRIC RANK
97.4%
6TH GRADE
97.3/ 100
METRIC RATING
109th/ 347
METRIC RANK
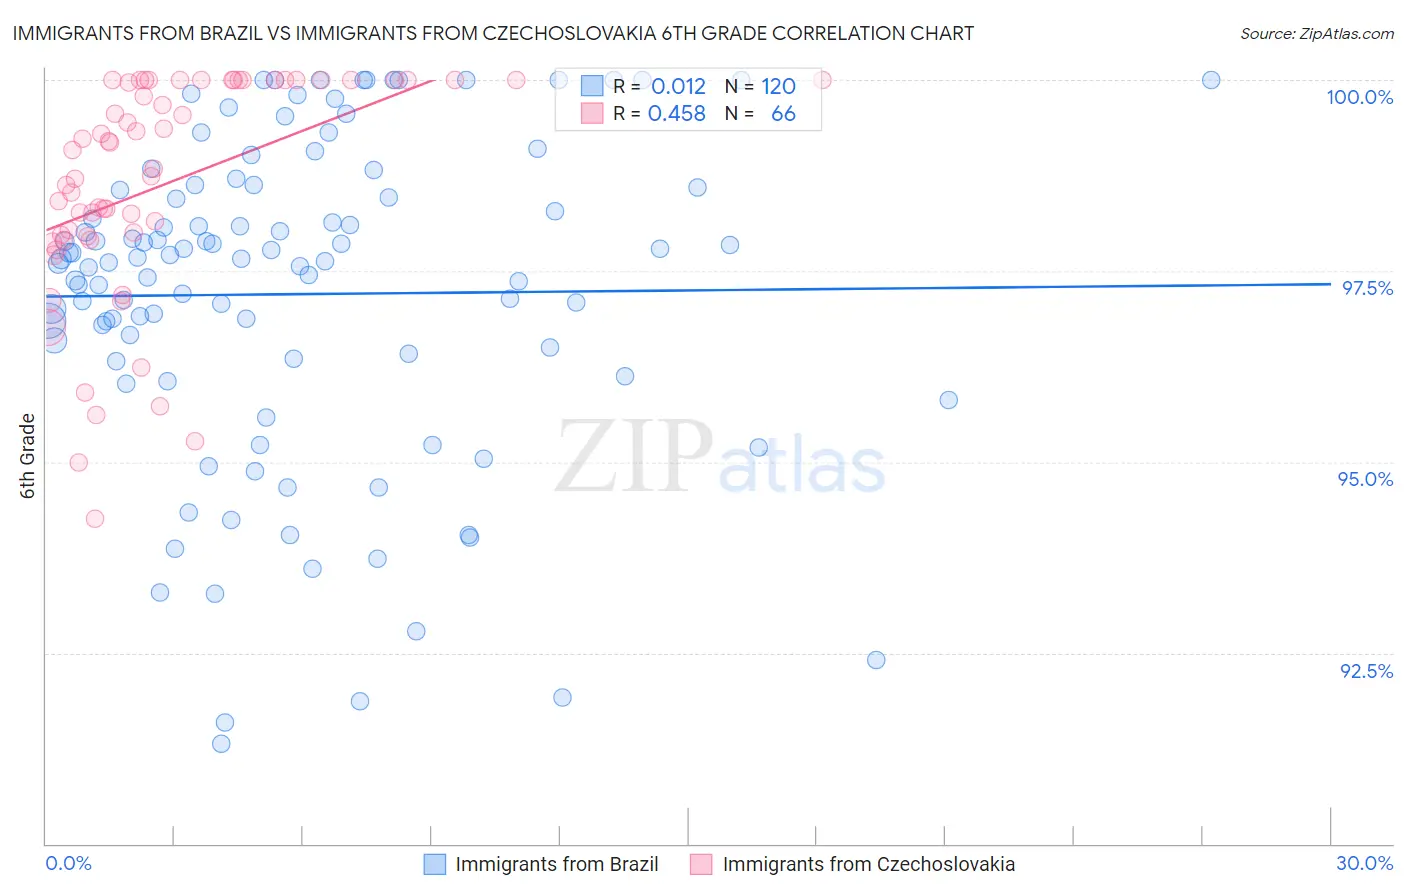
Immigrants from Brazil vs Immigrants from Czechoslovakia 6th Grade Correlation Chart
The statistical analysis conducted on geographies consisting of 343,021,580 people shows no correlation between the proportion of Immigrants from Brazil and percentage of population with at least 6th grade education in the United States with a correlation coefficient (R) of 0.012 and weighted average of 96.9%. Similarly, the statistical analysis conducted on geographies consisting of 195,448,060 people shows a moderate positive correlation between the proportion of Immigrants from Czechoslovakia and percentage of population with at least 6th grade education in the United States with a correlation coefficient (R) of 0.458 and weighted average of 97.4%, a difference of 0.53%.
6th Grade Correlation Summary
| Measurement | Immigrants from Brazil | Immigrants from Czechoslovakia |
| Minimum | 91.3% | 94.3% |
| Maximum | 100.0% | 100.0% |
| Range | 8.7% | 5.7% |
| Mean | 97.2% | 98.6% |
| Median | 97.6% | 99.0% |
| Interquartile 25% (IQ1) | 96.3% | 98.0% |
| Interquartile 75% (IQ3) | 98.6% | 100.0% |
| Interquartile Range (IQR) | 2.2% | 2.0% |
| Standard Deviation (Sample) | 2.1% | 1.5% |
| Standard Deviation (Population) | 2.1% | 1.4% |
Similar Demographics by 6th Grade
Demographics Similar to Immigrants from Brazil by 6th Grade
In terms of 6th grade, the demographic groups most similar to Immigrants from Brazil are Immigrants from Lebanon (96.9%, a difference of 0.0%), Panamanian (96.9%, a difference of 0.010%), Hawaiian (96.9%, a difference of 0.010%), Paraguayan (96.9%, a difference of 0.010%), and Dutch West Indian (96.9%, a difference of 0.020%).
| Demographics | Rating | Rank | 6th Grade |
| Immigrants | Argentina | 30.4 /100 | #188 | Fair 97.0% |
| Blacks/African Americans | 30.2 /100 | #189 | Fair 97.0% |
| Dutch West Indians | 28.3 /100 | #190 | Fair 96.9% |
| Panamanians | 27.3 /100 | #191 | Fair 96.9% |
| Hawaiians | 27.0 /100 | #192 | Fair 96.9% |
| Paraguayans | 26.6 /100 | #193 | Fair 96.9% |
| Immigrants | Lebanon | 25.6 /100 | #194 | Fair 96.9% |
| Immigrants | Brazil | 25.5 /100 | #195 | Fair 96.9% |
| Immigrants | Uganda | 21.2 /100 | #196 | Fair 96.9% |
| Brazilians | 20.1 /100 | #197 | Fair 96.9% |
| Immigrants | Albania | 18.8 /100 | #198 | Poor 96.9% |
| Immigrants | Northern Africa | 15.7 /100 | #199 | Poor 96.9% |
| Africans | 14.8 /100 | #200 | Poor 96.9% |
| Immigrants | Zaire | 14.5 /100 | #201 | Poor 96.9% |
| Immigrants | Chile | 14.2 /100 | #202 | Poor 96.8% |
Demographics Similar to Immigrants from Czechoslovakia by 6th Grade
In terms of 6th grade, the demographic groups most similar to Immigrants from Czechoslovakia are Nonimmigrants (97.4%, a difference of 0.0%), Immigrants from Singapore (97.5%, a difference of 0.010%), Menominee (97.5%, a difference of 0.020%), Thai (97.4%, a difference of 0.020%), and Iroquois (97.4%, a difference of 0.020%).
| Demographics | Rating | Rank | 6th Grade |
| Choctaw | 98.0 /100 | #102 | Exceptional 97.5% |
| Bhutanese | 98.0 /100 | #103 | Exceptional 97.5% |
| German Russians | 97.9 /100 | #104 | Exceptional 97.5% |
| Cheyenne | 97.9 /100 | #105 | Exceptional 97.5% |
| Menominee | 97.7 /100 | #106 | Exceptional 97.5% |
| Immigrants | Singapore | 97.6 /100 | #107 | Exceptional 97.5% |
| Immigrants | Nonimmigrants | 97.3 /100 | #108 | Exceptional 97.4% |
| Immigrants | Czechoslovakia | 97.3 /100 | #109 | Exceptional 97.4% |
| Thais | 96.9 /100 | #110 | Exceptional 97.4% |
| Iroquois | 96.9 /100 | #111 | Exceptional 97.4% |
| Immigrants | Latvia | 96.7 /100 | #112 | Exceptional 97.4% |
| Immigrants | Saudi Arabia | 96.5 /100 | #113 | Exceptional 97.4% |
| Colville | 96.4 /100 | #114 | Exceptional 97.4% |
| Immigrants | Switzerland | 95.7 /100 | #115 | Exceptional 97.4% |
| Lebanese | 95.5 /100 | #116 | Exceptional 97.4% |