Immigrants from Brazil vs Asian Master's Degree
COMPARE
Immigrants from Brazil
Asian
Master's Degree
Master's Degree Comparison
Immigrants from Brazil
Asians
17.4%
MASTER'S DEGREE
99.4/ 100
METRIC RATING
85th/ 347
METRIC RANK
18.4%
MASTER'S DEGREE
99.9/ 100
METRIC RATING
56th/ 347
METRIC RANK
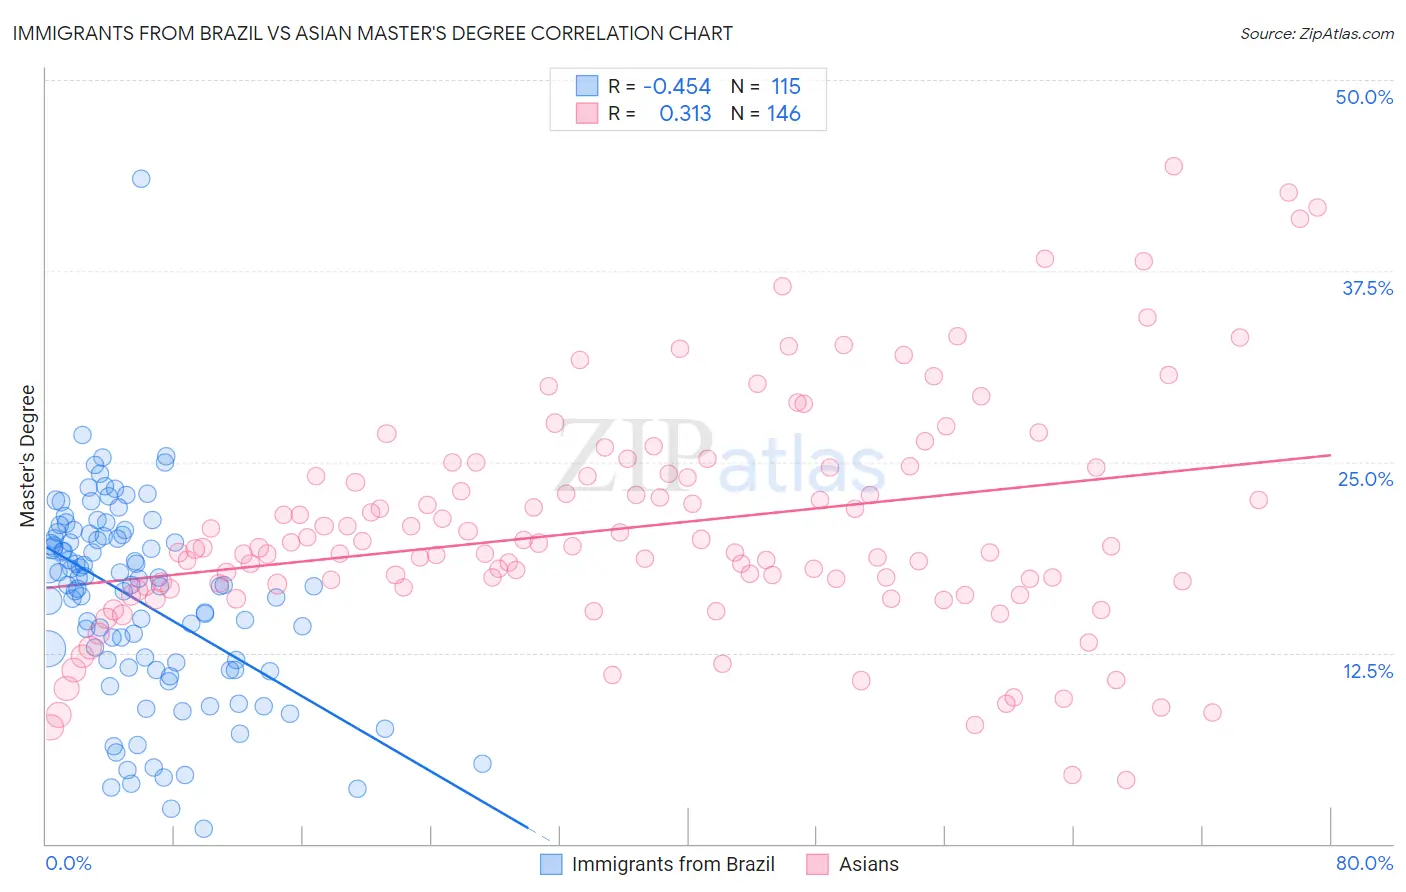
Immigrants from Brazil vs Asian Master's Degree Correlation Chart
The statistical analysis conducted on geographies consisting of 342,959,750 people shows a moderate negative correlation between the proportion of Immigrants from Brazil and percentage of population with at least master's degree education in the United States with a correlation coefficient (R) of -0.454 and weighted average of 17.4%. Similarly, the statistical analysis conducted on geographies consisting of 550,412,618 people shows a mild positive correlation between the proportion of Asians and percentage of population with at least master's degree education in the United States with a correlation coefficient (R) of 0.313 and weighted average of 18.4%, a difference of 6.3%.
Master's Degree Correlation Summary
| Measurement | Immigrants from Brazil | Asian |
| Minimum | 0.97% | 4.2% |
| Maximum | 43.5% | 44.3% |
| Range | 42.6% | 40.2% |
| Mean | 15.9% | 20.7% |
| Median | 16.9% | 19.3% |
| Interquartile 25% (IQ1) | 11.5% | 16.8% |
| Interquartile 75% (IQ3) | 20.2% | 24.2% |
| Interquartile Range (IQR) | 8.7% | 7.4% |
| Standard Deviation (Sample) | 6.5% | 7.5% |
| Standard Deviation (Population) | 6.4% | 7.5% |
Similar Demographics by Master's Degree
Demographics Similar to Immigrants from Brazil by Master's Degree
In terms of master's degree, the demographic groups most similar to Immigrants from Brazil are Immigrants from Scotland (17.4%, a difference of 0.18%), Immigrants from Croatia (17.3%, a difference of 0.41%), Immigrants from Zimbabwe (17.4%, a difference of 0.51%), Maltese (17.3%, a difference of 0.51%), and Greek (17.5%, a difference of 0.57%).
| Demographics | Rating | Rank | Master's Degree |
| Immigrants | Hungary | 99.6 /100 | #78 | Exceptional 17.5% |
| Immigrants | Lebanon | 99.6 /100 | #79 | Exceptional 17.5% |
| Carpatho Rusyns | 99.6 /100 | #80 | Exceptional 17.5% |
| Immigrants | Western Asia | 99.5 /100 | #81 | Exceptional 17.5% |
| Greeks | 99.5 /100 | #82 | Exceptional 17.5% |
| Immigrants | Zimbabwe | 99.5 /100 | #83 | Exceptional 17.4% |
| Immigrants | Scotland | 99.4 /100 | #84 | Exceptional 17.4% |
| Immigrants | Brazil | 99.4 /100 | #85 | Exceptional 17.4% |
| Immigrants | Croatia | 99.3 /100 | #86 | Exceptional 17.3% |
| Maltese | 99.3 /100 | #87 | Exceptional 17.3% |
| Immigrants | Canada | 99.2 /100 | #88 | Exceptional 17.2% |
| Bhutanese | 99.1 /100 | #89 | Exceptional 17.2% |
| Immigrants | Egypt | 99.1 /100 | #90 | Exceptional 17.2% |
| Romanians | 99.1 /100 | #91 | Exceptional 17.2% |
| Immigrants | North America | 99.1 /100 | #92 | Exceptional 17.2% |
Demographics Similar to Asians by Master's Degree
In terms of master's degree, the demographic groups most similar to Asians are Immigrants from Asia (18.4%, a difference of 0.14%), Immigrants from Serbia (18.5%, a difference of 0.22%), Immigrants from Lithuania (18.5%, a difference of 0.26%), Australian (18.4%, a difference of 0.27%), and Immigrants from Czechoslovakia (18.5%, a difference of 0.57%).
| Demographics | Rating | Rank | Master's Degree |
| Estonians | 100.0 /100 | #49 | Exceptional 18.8% |
| Bulgarians | 100.0 /100 | #50 | Exceptional 18.8% |
| Immigrants | South Africa | 100.0 /100 | #51 | Exceptional 18.8% |
| Immigrants | Kuwait | 100.0 /100 | #52 | Exceptional 18.6% |
| Immigrants | Czechoslovakia | 99.9 /100 | #53 | Exceptional 18.5% |
| Immigrants | Lithuania | 99.9 /100 | #54 | Exceptional 18.5% |
| Immigrants | Serbia | 99.9 /100 | #55 | Exceptional 18.5% |
| Asians | 99.9 /100 | #56 | Exceptional 18.4% |
| Immigrants | Asia | 99.9 /100 | #57 | Exceptional 18.4% |
| Australians | 99.9 /100 | #58 | Exceptional 18.4% |
| Immigrants | Bulgaria | 99.9 /100 | #59 | Exceptional 18.3% |
| New Zealanders | 99.9 /100 | #60 | Exceptional 18.3% |
| Immigrants | Europe | 99.9 /100 | #61 | Exceptional 18.2% |
| Argentineans | 99.9 /100 | #62 | Exceptional 18.2% |
| Immigrants | Netherlands | 99.9 /100 | #63 | Exceptional 18.1% |