Immigrants from Brazil vs Asian No Schooling Completed
COMPARE
Immigrants from Brazil
Asian
No Schooling Completed
No Schooling Completed Comparison
Immigrants from Brazil
Asians
2.1%
NO SCHOOLING COMPLETED
63.8/ 100
METRIC RATING
162nd/ 347
METRIC RANK
2.4%
NO SCHOOLING COMPLETED
1.2/ 100
METRIC RATING
248th/ 347
METRIC RANK
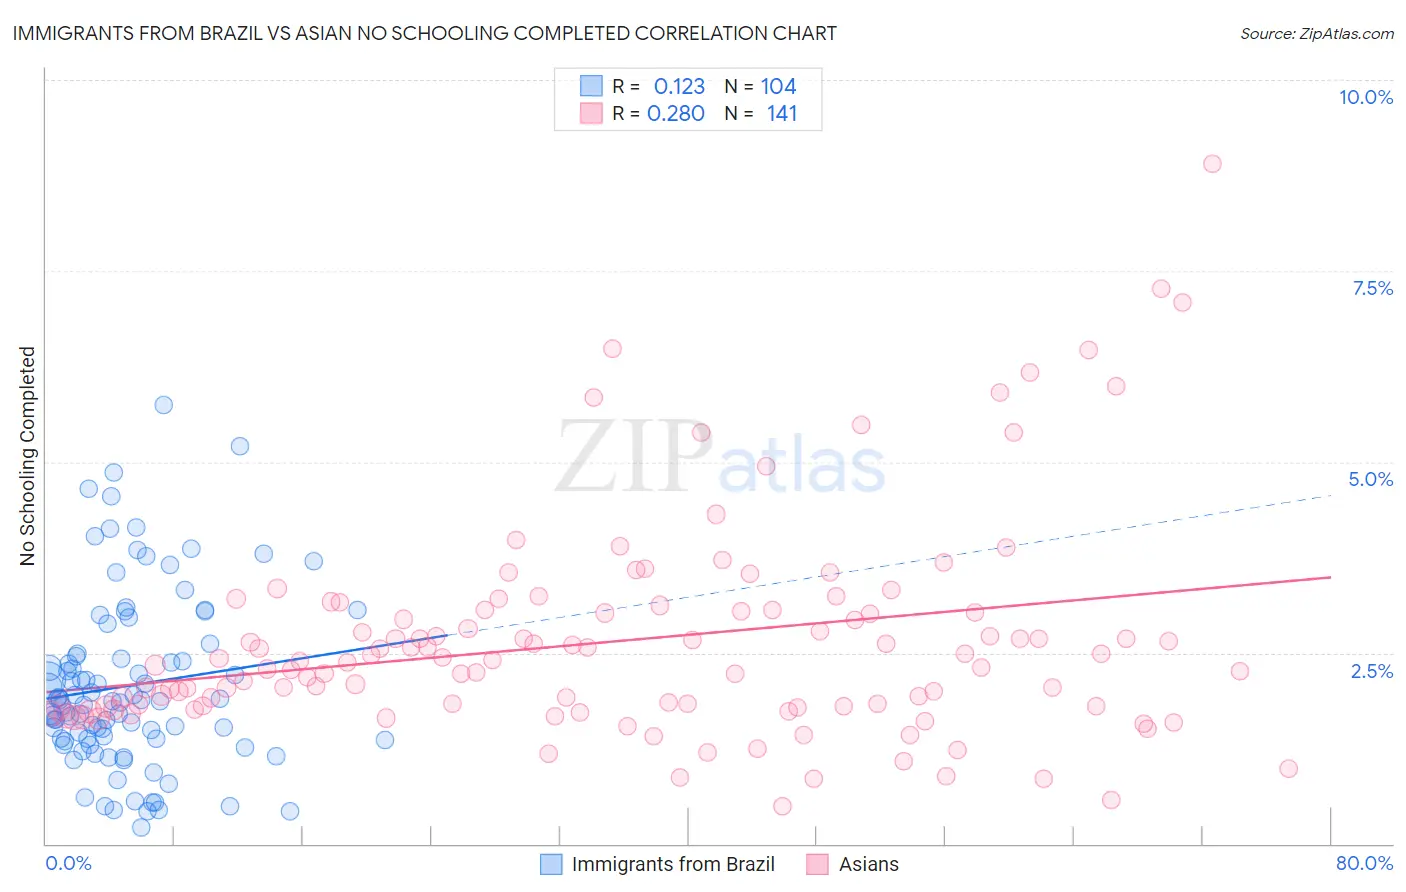
Immigrants from Brazil vs Asian No Schooling Completed Correlation Chart
The statistical analysis conducted on geographies consisting of 340,005,374 people shows a poor positive correlation between the proportion of Immigrants from Brazil and percentage of population with no schooling in the United States with a correlation coefficient (R) of 0.123 and weighted average of 2.1%. Similarly, the statistical analysis conducted on geographies consisting of 537,405,383 people shows a weak positive correlation between the proportion of Asians and percentage of population with no schooling in the United States with a correlation coefficient (R) of 0.280 and weighted average of 2.4%, a difference of 17.0%.
No Schooling Completed Correlation Summary
| Measurement | Immigrants from Brazil | Asian |
| Minimum | 0.21% | 0.49% |
| Maximum | 5.7% | 8.9% |
| Range | 5.5% | 8.4% |
| Mean | 2.1% | 2.7% |
| Median | 1.9% | 2.4% |
| Interquartile 25% (IQ1) | 1.4% | 1.8% |
| Interquartile 75% (IQ3) | 2.5% | 3.1% |
| Interquartile Range (IQR) | 1.1% | 1.3% |
| Standard Deviation (Sample) | 1.1% | 1.4% |
| Standard Deviation (Population) | 1.1% | 1.4% |
Similar Demographics by No Schooling Completed
Demographics Similar to Immigrants from Brazil by No Schooling Completed
In terms of no schooling completed, the demographic groups most similar to Immigrants from Brazil are Ugandan (2.0%, a difference of 0.11%), Albanian (2.1%, a difference of 0.24%), Kenyan (2.0%, a difference of 0.28%), Immigrants from Spain (2.0%, a difference of 0.39%), and Immigrants from Korea (2.0%, a difference of 0.44%).
| Demographics | Rating | Rank | No Schooling Completed |
| Immigrants | Russia | 67.6 /100 | #155 | Good 2.0% |
| Chileans | 67.2 /100 | #156 | Good 2.0% |
| Immigrants | Sri Lanka | 67.0 /100 | #157 | Good 2.0% |
| Immigrants | Korea | 66.7 /100 | #158 | Good 2.0% |
| Immigrants | Spain | 66.4 /100 | #159 | Good 2.0% |
| Kenyans | 65.7 /100 | #160 | Good 2.0% |
| Ugandans | 64.6 /100 | #161 | Good 2.0% |
| Immigrants | Brazil | 63.8 /100 | #162 | Good 2.1% |
| Albanians | 62.2 /100 | #163 | Good 2.1% |
| Comanche | 60.7 /100 | #164 | Good 2.1% |
| Brazilians | 60.2 /100 | #165 | Good 2.1% |
| Dutch West Indians | 59.9 /100 | #166 | Average 2.1% |
| Egyptians | 59.2 /100 | #167 | Average 2.1% |
| Cheyenne | 58.6 /100 | #168 | Average 2.1% |
| Apache | 56.7 /100 | #169 | Average 2.1% |
Demographics Similar to Asians by No Schooling Completed
In terms of no schooling completed, the demographic groups most similar to Asians are Jamaican (2.4%, a difference of 0.19%), Immigrants from Middle Africa (2.4%, a difference of 0.24%), Immigrants from Africa (2.4%, a difference of 0.25%), Immigrants from Iraq (2.4%, a difference of 0.27%), and Immigrants from Congo (2.4%, a difference of 0.37%).
| Demographics | Rating | Rank | No Schooling Completed |
| Koreans | 1.7 /100 | #241 | Tragic 2.4% |
| Immigrants | Indonesia | 1.5 /100 | #242 | Tragic 2.4% |
| South Americans | 1.5 /100 | #243 | Tragic 2.4% |
| Peruvians | 1.4 /100 | #244 | Tragic 2.4% |
| Bolivians | 1.4 /100 | #245 | Tragic 2.4% |
| Immigrants | Congo | 1.4 /100 | #246 | Tragic 2.4% |
| Immigrants | Iraq | 1.3 /100 | #247 | Tragic 2.4% |
| Asians | 1.2 /100 | #248 | Tragic 2.4% |
| Jamaicans | 1.2 /100 | #249 | Tragic 2.4% |
| Immigrants | Middle Africa | 1.1 /100 | #250 | Tragic 2.4% |
| Immigrants | Africa | 1.1 /100 | #251 | Tragic 2.4% |
| Immigrants | Colombia | 1.0 /100 | #252 | Tragic 2.4% |
| Immigrants | Asia | 0.9 /100 | #253 | Tragic 2.4% |
| Immigrants | Eastern Africa | 0.9 /100 | #254 | Tragic 2.4% |
| Ethiopians | 0.8 /100 | #255 | Tragic 2.4% |