Immigrants from Chile vs Asian Master's Degree
COMPARE
Immigrants from Chile
Asian
Master's Degree
Master's Degree Comparison
Immigrants from Chile
Asians
16.8%
MASTER'S DEGREE
98.0/ 100
METRIC RATING
110th/ 347
METRIC RANK
18.4%
MASTER'S DEGREE
99.9/ 100
METRIC RATING
56th/ 347
METRIC RANK
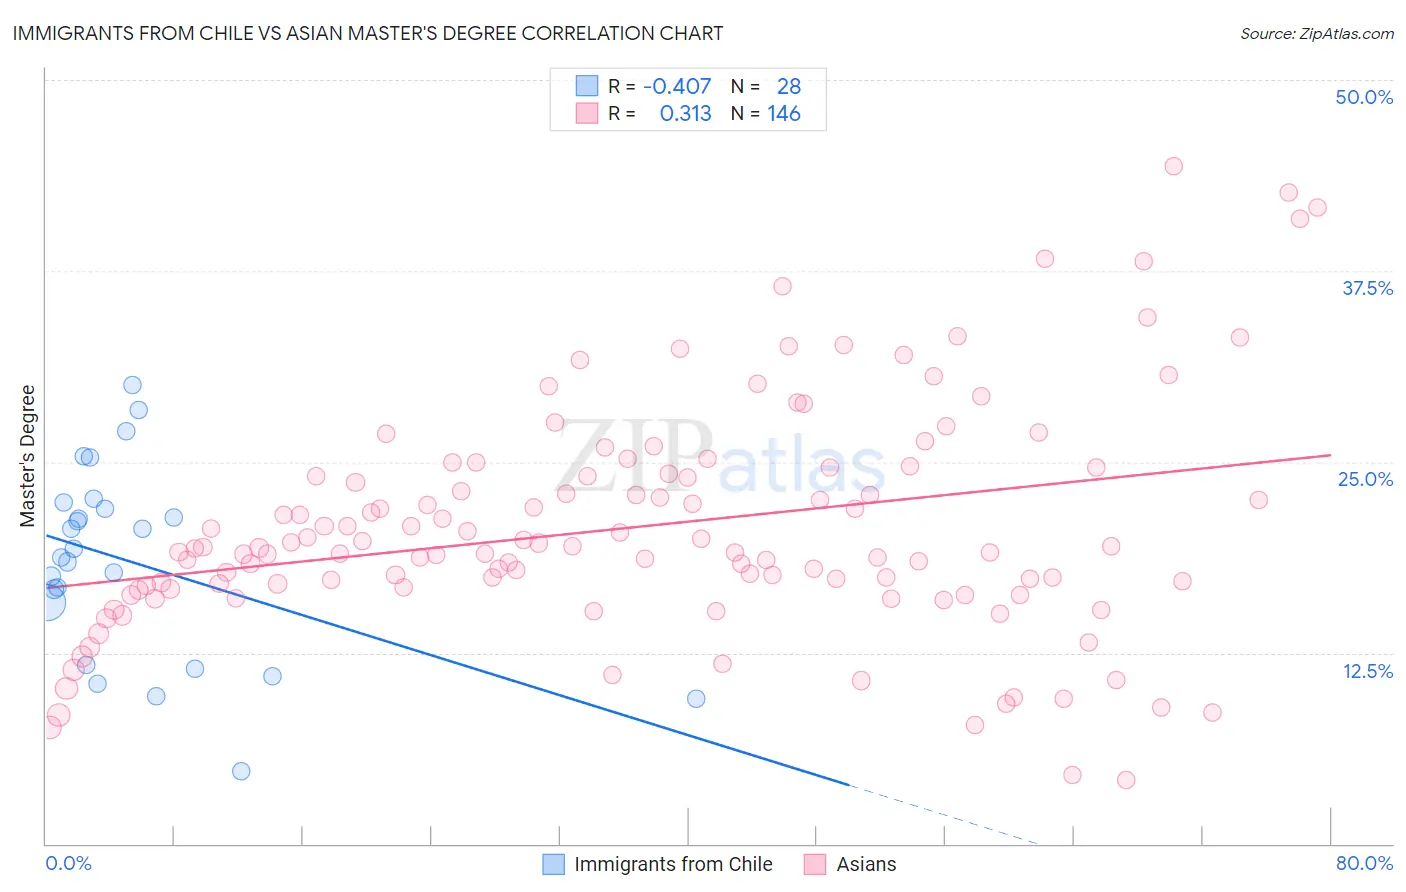
Immigrants from Chile vs Asian Master's Degree Correlation Chart
The statistical analysis conducted on geographies consisting of 218,626,244 people shows a moderate negative correlation between the proportion of Immigrants from Chile and percentage of population with at least master's degree education in the United States with a correlation coefficient (R) of -0.407 and weighted average of 16.8%. Similarly, the statistical analysis conducted on geographies consisting of 550,412,618 people shows a mild positive correlation between the proportion of Asians and percentage of population with at least master's degree education in the United States with a correlation coefficient (R) of 0.313 and weighted average of 18.4%, a difference of 10.0%.
Master's Degree Correlation Summary
| Measurement | Immigrants from Chile | Asian |
| Minimum | 4.8% | 4.2% |
| Maximum | 30.0% | 44.3% |
| Range | 25.2% | 40.2% |
| Mean | 18.5% | 20.7% |
| Median | 19.0% | 19.3% |
| Interquartile 25% (IQ1) | 13.8% | 16.8% |
| Interquartile 75% (IQ3) | 22.1% | 24.2% |
| Interquartile Range (IQR) | 8.3% | 7.4% |
| Standard Deviation (Sample) | 6.2% | 7.5% |
| Standard Deviation (Population) | 6.1% | 7.5% |
Similar Demographics by Master's Degree
Demographics Similar to Immigrants from Chile by Master's Degree
In terms of master's degree, the demographic groups most similar to Immigrants from Chile are Moroccan (16.8%, a difference of 0.030%), Sierra Leonean (16.8%, a difference of 0.050%), Armenian (16.8%, a difference of 0.080%), Immigrants from Albania (16.8%, a difference of 0.17%), and Austrian (16.7%, a difference of 0.27%).
| Demographics | Rating | Rank | Master's Degree |
| Alsatians | 98.4 /100 | #103 | Exceptional 16.9% |
| Ukrainians | 98.3 /100 | #104 | Exceptional 16.9% |
| Syrians | 98.3 /100 | #105 | Exceptional 16.8% |
| Immigrants | Albania | 98.1 /100 | #106 | Exceptional 16.8% |
| Armenians | 98.0 /100 | #107 | Exceptional 16.8% |
| Sierra Leoneans | 98.0 /100 | #108 | Exceptional 16.8% |
| Moroccans | 98.0 /100 | #109 | Exceptional 16.8% |
| Immigrants | Chile | 98.0 /100 | #110 | Exceptional 16.8% |
| Austrians | 97.8 /100 | #111 | Exceptional 16.7% |
| Macedonians | 97.7 /100 | #112 | Exceptional 16.7% |
| Arabs | 97.7 /100 | #113 | Exceptional 16.7% |
| Northern Europeans | 97.6 /100 | #114 | Exceptional 16.7% |
| Immigrants | Uganda | 97.3 /100 | #115 | Exceptional 16.6% |
| Immigrants | Southern Europe | 97.2 /100 | #116 | Exceptional 16.6% |
| Immigrants | Moldova | 97.2 /100 | #117 | Exceptional 16.6% |
Demographics Similar to Asians by Master's Degree
In terms of master's degree, the demographic groups most similar to Asians are Immigrants from Asia (18.4%, a difference of 0.14%), Immigrants from Serbia (18.5%, a difference of 0.22%), Immigrants from Lithuania (18.5%, a difference of 0.26%), Australian (18.4%, a difference of 0.27%), and Immigrants from Czechoslovakia (18.5%, a difference of 0.57%).
| Demographics | Rating | Rank | Master's Degree |
| Estonians | 100.0 /100 | #49 | Exceptional 18.8% |
| Bulgarians | 100.0 /100 | #50 | Exceptional 18.8% |
| Immigrants | South Africa | 100.0 /100 | #51 | Exceptional 18.8% |
| Immigrants | Kuwait | 100.0 /100 | #52 | Exceptional 18.6% |
| Immigrants | Czechoslovakia | 99.9 /100 | #53 | Exceptional 18.5% |
| Immigrants | Lithuania | 99.9 /100 | #54 | Exceptional 18.5% |
| Immigrants | Serbia | 99.9 /100 | #55 | Exceptional 18.5% |
| Asians | 99.9 /100 | #56 | Exceptional 18.4% |
| Immigrants | Asia | 99.9 /100 | #57 | Exceptional 18.4% |
| Australians | 99.9 /100 | #58 | Exceptional 18.4% |
| Immigrants | Bulgaria | 99.9 /100 | #59 | Exceptional 18.3% |
| New Zealanders | 99.9 /100 | #60 | Exceptional 18.3% |
| Immigrants | Europe | 99.9 /100 | #61 | Exceptional 18.2% |
| Argentineans | 99.9 /100 | #62 | Exceptional 18.2% |
| Immigrants | Netherlands | 99.9 /100 | #63 | Exceptional 18.1% |