Immigrants from Brazil vs Ghanaian Master's Degree
COMPARE
Immigrants from Brazil
Ghanaian
Master's Degree
Master's Degree Comparison
Immigrants from Brazil
Ghanaians
17.4%
MASTER'S DEGREE
99.4/ 100
METRIC RATING
85th/ 347
METRIC RANK
15.5%
MASTER'S DEGREE
78.2/ 100
METRIC RATING
149th/ 347
METRIC RANK
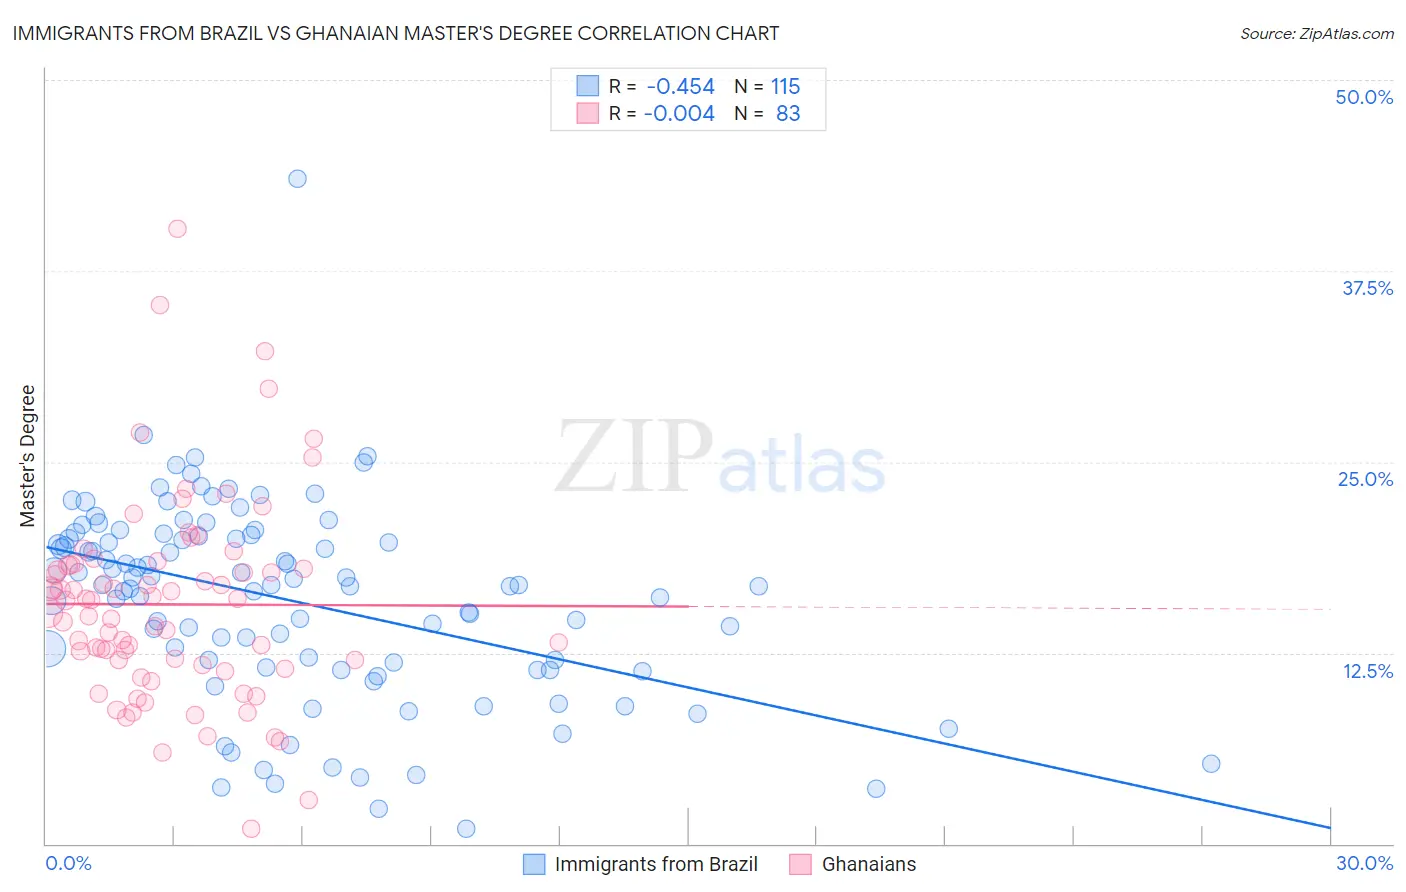
Immigrants from Brazil vs Ghanaian Master's Degree Correlation Chart
The statistical analysis conducted on geographies consisting of 342,959,750 people shows a moderate negative correlation between the proportion of Immigrants from Brazil and percentage of population with at least master's degree education in the United States with a correlation coefficient (R) of -0.454 and weighted average of 17.4%. Similarly, the statistical analysis conducted on geographies consisting of 190,610,079 people shows no correlation between the proportion of Ghanaians and percentage of population with at least master's degree education in the United States with a correlation coefficient (R) of -0.004 and weighted average of 15.5%, a difference of 11.7%.
Master's Degree Correlation Summary
| Measurement | Immigrants from Brazil | Ghanaian |
| Minimum | 0.97% | 0.95% |
| Maximum | 43.5% | 40.3% |
| Range | 42.6% | 39.3% |
| Mean | 15.9% | 15.7% |
| Median | 16.9% | 15.9% |
| Interquartile 25% (IQ1) | 11.5% | 11.7% |
| Interquartile 75% (IQ3) | 20.2% | 18.2% |
| Interquartile Range (IQR) | 8.7% | 6.5% |
| Standard Deviation (Sample) | 6.5% | 6.6% |
| Standard Deviation (Population) | 6.4% | 6.6% |
Similar Demographics by Master's Degree
Demographics Similar to Immigrants from Brazil by Master's Degree
In terms of master's degree, the demographic groups most similar to Immigrants from Brazil are Immigrants from Scotland (17.4%, a difference of 0.18%), Immigrants from Croatia (17.3%, a difference of 0.41%), Immigrants from Zimbabwe (17.4%, a difference of 0.51%), Maltese (17.3%, a difference of 0.51%), and Greek (17.5%, a difference of 0.57%).
| Demographics | Rating | Rank | Master's Degree |
| Immigrants | Hungary | 99.6 /100 | #78 | Exceptional 17.5% |
| Immigrants | Lebanon | 99.6 /100 | #79 | Exceptional 17.5% |
| Carpatho Rusyns | 99.6 /100 | #80 | Exceptional 17.5% |
| Immigrants | Western Asia | 99.5 /100 | #81 | Exceptional 17.5% |
| Greeks | 99.5 /100 | #82 | Exceptional 17.5% |
| Immigrants | Zimbabwe | 99.5 /100 | #83 | Exceptional 17.4% |
| Immigrants | Scotland | 99.4 /100 | #84 | Exceptional 17.4% |
| Immigrants | Brazil | 99.4 /100 | #85 | Exceptional 17.4% |
| Immigrants | Croatia | 99.3 /100 | #86 | Exceptional 17.3% |
| Maltese | 99.3 /100 | #87 | Exceptional 17.3% |
| Immigrants | Canada | 99.2 /100 | #88 | Exceptional 17.2% |
| Bhutanese | 99.1 /100 | #89 | Exceptional 17.2% |
| Immigrants | Egypt | 99.1 /100 | #90 | Exceptional 17.2% |
| Romanians | 99.1 /100 | #91 | Exceptional 17.2% |
| Immigrants | North America | 99.1 /100 | #92 | Exceptional 17.2% |
Demographics Similar to Ghanaians by Master's Degree
In terms of master's degree, the demographic groups most similar to Ghanaians are Immigrants from Senegal (15.5%, a difference of 0.010%), Slovene (15.5%, a difference of 0.030%), Iraqi (15.5%, a difference of 0.16%), Hungarian (15.6%, a difference of 0.18%), and Slavic (15.5%, a difference of 0.21%).
| Demographics | Rating | Rank | Master's Degree |
| Immigrants | Africa | 84.0 /100 | #142 | Excellent 15.7% |
| Immigrants | Venezuela | 83.6 /100 | #143 | Excellent 15.7% |
| Canadians | 83.3 /100 | #144 | Excellent 15.7% |
| South Americans | 81.3 /100 | #145 | Excellent 15.6% |
| Immigrants | Afghanistan | 79.4 /100 | #146 | Good 15.6% |
| Hungarians | 79.1 /100 | #147 | Good 15.6% |
| Immigrants | Senegal | 78.2 /100 | #148 | Good 15.5% |
| Ghanaians | 78.2 /100 | #149 | Good 15.5% |
| Slovenes | 78.0 /100 | #150 | Good 15.5% |
| Iraqis | 77.3 /100 | #151 | Good 15.5% |
| Slavs | 77.0 /100 | #152 | Good 15.5% |
| Icelanders | 76.8 /100 | #153 | Good 15.5% |
| Immigrants | South America | 76.3 /100 | #154 | Good 15.5% |
| Immigrants | Bangladesh | 76.1 /100 | #155 | Good 15.5% |
| Bermudans | 73.9 /100 | #156 | Good 15.4% |