Carpatho Rusyn vs Asian Master's Degree
COMPARE
Carpatho Rusyn
Asian
Master's Degree
Master's Degree Comparison
Carpatho Rusyns
Asians
17.5%
MASTER'S DEGREE
99.6/ 100
METRIC RATING
80th/ 347
METRIC RANK
18.4%
MASTER'S DEGREE
99.9/ 100
METRIC RATING
56th/ 347
METRIC RANK
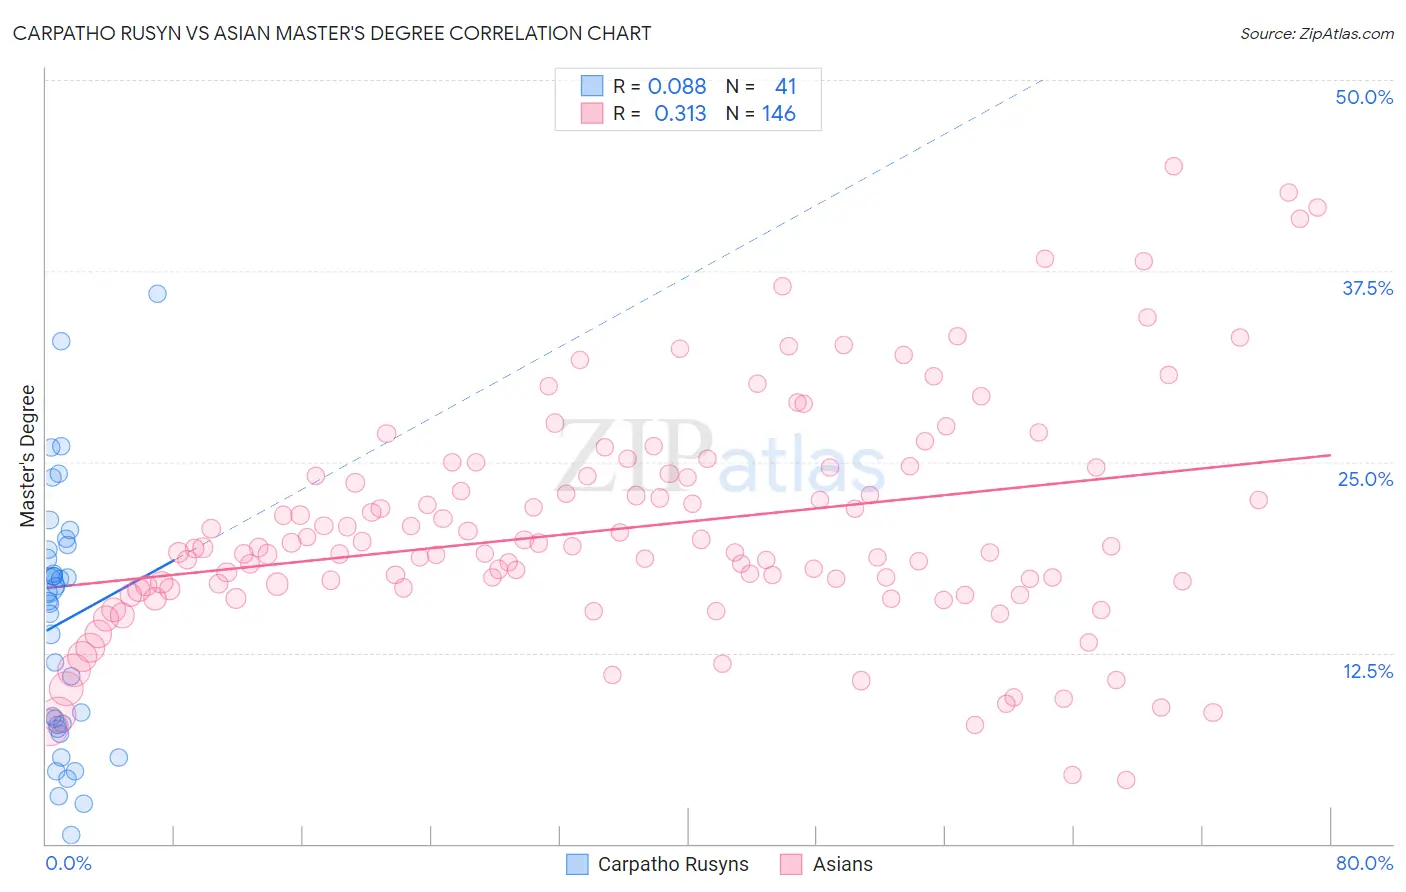
Carpatho Rusyn vs Asian Master's Degree Correlation Chart
The statistical analysis conducted on geographies consisting of 58,870,133 people shows a slight positive correlation between the proportion of Carpatho Rusyns and percentage of population with at least master's degree education in the United States with a correlation coefficient (R) of 0.088 and weighted average of 17.5%. Similarly, the statistical analysis conducted on geographies consisting of 550,412,618 people shows a mild positive correlation between the proportion of Asians and percentage of population with at least master's degree education in the United States with a correlation coefficient (R) of 0.313 and weighted average of 18.4%, a difference of 5.3%.
Master's Degree Correlation Summary
| Measurement | Carpatho Rusyn | Asian |
| Minimum | 0.58% | 4.2% |
| Maximum | 36.0% | 44.3% |
| Range | 35.4% | 40.2% |
| Mean | 14.5% | 20.7% |
| Median | 15.9% | 19.3% |
| Interquartile 25% (IQ1) | 7.6% | 16.8% |
| Interquartile 75% (IQ3) | 19.4% | 24.2% |
| Interquartile Range (IQR) | 11.8% | 7.4% |
| Standard Deviation (Sample) | 8.3% | 7.5% |
| Standard Deviation (Population) | 8.2% | 7.5% |
Similar Demographics by Master's Degree
Demographics Similar to Carpatho Rusyns by Master's Degree
In terms of master's degree, the demographic groups most similar to Carpatho Rusyns are Immigrants from Lebanon (17.5%, a difference of 0.050%), Immigrants from Hungary (17.5%, a difference of 0.19%), Immigrants from Western Asia (17.5%, a difference of 0.30%), Greek (17.5%, a difference of 0.35%), and Immigrants from Eastern Europe (17.6%, a difference of 0.38%).
| Demographics | Rating | Rank | Master's Degree |
| Zimbabweans | 99.7 /100 | #73 | Exceptional 17.7% |
| Immigrants | Romania | 99.7 /100 | #74 | Exceptional 17.7% |
| Egyptians | 99.6 /100 | #75 | Exceptional 17.6% |
| Immigrants | Indonesia | 99.6 /100 | #76 | Exceptional 17.6% |
| Immigrants | Eastern Europe | 99.6 /100 | #77 | Exceptional 17.6% |
| Immigrants | Hungary | 99.6 /100 | #78 | Exceptional 17.5% |
| Immigrants | Lebanon | 99.6 /100 | #79 | Exceptional 17.5% |
| Carpatho Rusyns | 99.6 /100 | #80 | Exceptional 17.5% |
| Immigrants | Western Asia | 99.5 /100 | #81 | Exceptional 17.5% |
| Greeks | 99.5 /100 | #82 | Exceptional 17.5% |
| Immigrants | Zimbabwe | 99.5 /100 | #83 | Exceptional 17.4% |
| Immigrants | Scotland | 99.4 /100 | #84 | Exceptional 17.4% |
| Immigrants | Brazil | 99.4 /100 | #85 | Exceptional 17.4% |
| Immigrants | Croatia | 99.3 /100 | #86 | Exceptional 17.3% |
| Maltese | 99.3 /100 | #87 | Exceptional 17.3% |
Demographics Similar to Asians by Master's Degree
In terms of master's degree, the demographic groups most similar to Asians are Immigrants from Asia (18.4%, a difference of 0.14%), Immigrants from Serbia (18.5%, a difference of 0.22%), Immigrants from Lithuania (18.5%, a difference of 0.26%), Australian (18.4%, a difference of 0.27%), and Immigrants from Czechoslovakia (18.5%, a difference of 0.57%).
| Demographics | Rating | Rank | Master's Degree |
| Estonians | 100.0 /100 | #49 | Exceptional 18.8% |
| Bulgarians | 100.0 /100 | #50 | Exceptional 18.8% |
| Immigrants | South Africa | 100.0 /100 | #51 | Exceptional 18.8% |
| Immigrants | Kuwait | 100.0 /100 | #52 | Exceptional 18.6% |
| Immigrants | Czechoslovakia | 99.9 /100 | #53 | Exceptional 18.5% |
| Immigrants | Lithuania | 99.9 /100 | #54 | Exceptional 18.5% |
| Immigrants | Serbia | 99.9 /100 | #55 | Exceptional 18.5% |
| Asians | 99.9 /100 | #56 | Exceptional 18.4% |
| Immigrants | Asia | 99.9 /100 | #57 | Exceptional 18.4% |
| Australians | 99.9 /100 | #58 | Exceptional 18.4% |
| Immigrants | Bulgaria | 99.9 /100 | #59 | Exceptional 18.3% |
| New Zealanders | 99.9 /100 | #60 | Exceptional 18.3% |
| Immigrants | Europe | 99.9 /100 | #61 | Exceptional 18.2% |
| Argentineans | 99.9 /100 | #62 | Exceptional 18.2% |
| Immigrants | Netherlands | 99.9 /100 | #63 | Exceptional 18.1% |