Immigrants from Nepal vs Immigrants 8th Grade
COMPARE
Immigrants from Nepal
Immigrants
8th Grade
8th Grade Comparison
Immigrants from Nepal
Immigrants
95.6%
8TH GRADE
30.2/ 100
METRIC RATING
191st/ 347
METRIC RANK
93.6%
8TH GRADE
0.0/ 100
METRIC RATING
309th/ 347
METRIC RANK
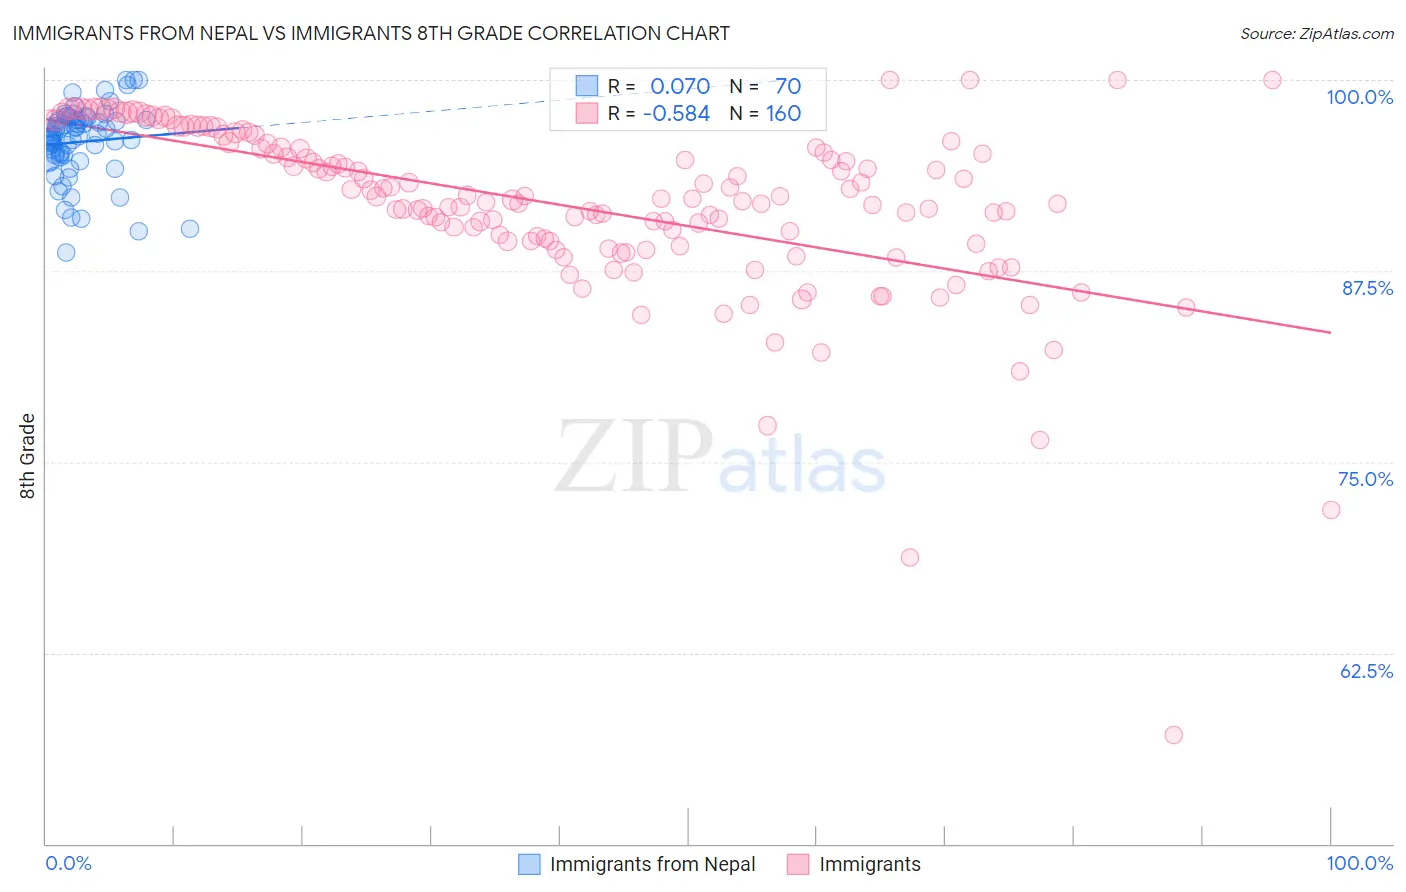
Immigrants from Nepal vs Immigrants 8th Grade Correlation Chart
The statistical analysis conducted on geographies consisting of 186,622,433 people shows a slight positive correlation between the proportion of Immigrants from Nepal and percentage of population with at least 8th grade education in the United States with a correlation coefficient (R) of 0.070 and weighted average of 95.6%. Similarly, the statistical analysis conducted on geographies consisting of 577,787,160 people shows a substantial negative correlation between the proportion of Immigrants and percentage of population with at least 8th grade education in the United States with a correlation coefficient (R) of -0.584 and weighted average of 93.6%, a difference of 2.2%.
8th Grade Correlation Summary
| Measurement | Immigrants from Nepal | Immigrants |
| Minimum | 88.7% | 57.2% |
| Maximum | 100.0% | 100.0% |
| Range | 11.3% | 42.8% |
| Mean | 96.0% | 91.8% |
| Median | 96.4% | 92.2% |
| Interquartile 25% (IQ1) | 95.1% | 89.4% |
| Interquartile 75% (IQ3) | 97.4% | 95.6% |
| Interquartile Range (IQR) | 2.3% | 6.1% |
| Standard Deviation (Sample) | 2.4% | 5.8% |
| Standard Deviation (Population) | 2.4% | 5.8% |
Similar Demographics by 8th Grade
Demographics Similar to Immigrants from Nepal by 8th Grade
In terms of 8th grade, the demographic groups most similar to Immigrants from Nepal are Immigrants from Venezuela (95.6%, a difference of 0.0%), Immigrants from Micronesia (95.6%, a difference of 0.010%), Pima (95.6%, a difference of 0.010%), Panamanian (95.6%, a difference of 0.010%), and Sudanese (95.6%, a difference of 0.020%).
| Demographics | Rating | Rank | 8th Grade |
| Immigrants | Uganda | 36.0 /100 | #184 | Fair 95.6% |
| Blacks/African Americans | 34.8 /100 | #185 | Fair 95.6% |
| Brazilians | 34.8 /100 | #186 | Fair 95.6% |
| Sudanese | 33.0 /100 | #187 | Fair 95.6% |
| Liberians | 32.4 /100 | #188 | Fair 95.6% |
| Immigrants | Micronesia | 31.6 /100 | #189 | Fair 95.6% |
| Immigrants | Venezuela | 30.8 /100 | #190 | Fair 95.6% |
| Immigrants | Nepal | 30.2 /100 | #191 | Fair 95.6% |
| Pima | 28.6 /100 | #192 | Fair 95.6% |
| Panamanians | 28.4 /100 | #193 | Fair 95.6% |
| Guamanians/Chamorros | 26.6 /100 | #194 | Fair 95.6% |
| Immigrants | Zaire | 25.2 /100 | #195 | Fair 95.6% |
| Assyrians/Chaldeans/Syriacs | 24.5 /100 | #196 | Fair 95.6% |
| Sierra Leoneans | 24.3 /100 | #197 | Fair 95.6% |
| Paraguayans | 22.6 /100 | #198 | Fair 95.5% |
Demographics Similar to Immigrants by 8th Grade
In terms of 8th grade, the demographic groups most similar to Immigrants are Japanese (93.6%, a difference of 0.0%), Immigrants from Bangladesh (93.6%, a difference of 0.010%), Ecuadorian (93.6%, a difference of 0.020%), Cape Verdean (93.5%, a difference of 0.050%), and Immigrants from Caribbean (93.5%, a difference of 0.070%).
| Demographics | Rating | Rank | 8th Grade |
| Sri Lankans | 0.0 /100 | #302 | Tragic 94.0% |
| Immigrants | Dominica | 0.0 /100 | #303 | Tragic 94.0% |
| Guyanese | 0.0 /100 | #304 | Tragic 93.9% |
| Immigrants | Haiti | 0.0 /100 | #305 | Tragic 93.9% |
| Immigrants | Guyana | 0.0 /100 | #306 | Tragic 93.8% |
| Immigrants | Portugal | 0.0 /100 | #307 | Tragic 93.8% |
| Ecuadorians | 0.0 /100 | #308 | Tragic 93.6% |
| Immigrants | Immigrants | 0.0 /100 | #309 | Tragic 93.6% |
| Japanese | 0.0 /100 | #310 | Tragic 93.6% |
| Immigrants | Bangladesh | 0.0 /100 | #311 | Tragic 93.6% |
| Cape Verdeans | 0.0 /100 | #312 | Tragic 93.5% |
| Immigrants | Caribbean | 0.0 /100 | #313 | Tragic 93.5% |
| Immigrants | Vietnam | 0.0 /100 | #314 | Tragic 93.5% |
| Vietnamese | 0.0 /100 | #315 | Tragic 93.5% |
| Immigrants | Cambodia | 0.0 /100 | #316 | Tragic 93.3% |