Immigrants from Bolivia vs Immigrants from Austria 8th Grade
COMPARE
Immigrants from Bolivia
Immigrants from Austria
8th Grade
8th Grade Comparison
Immigrants from Bolivia
Immigrants from Austria
94.6%
8TH GRADE
0.1/ 100
METRIC RATING
281st/ 347
METRIC RANK
96.7%
8TH GRADE
99.8/ 100
METRIC RATING
61st/ 347
METRIC RANK
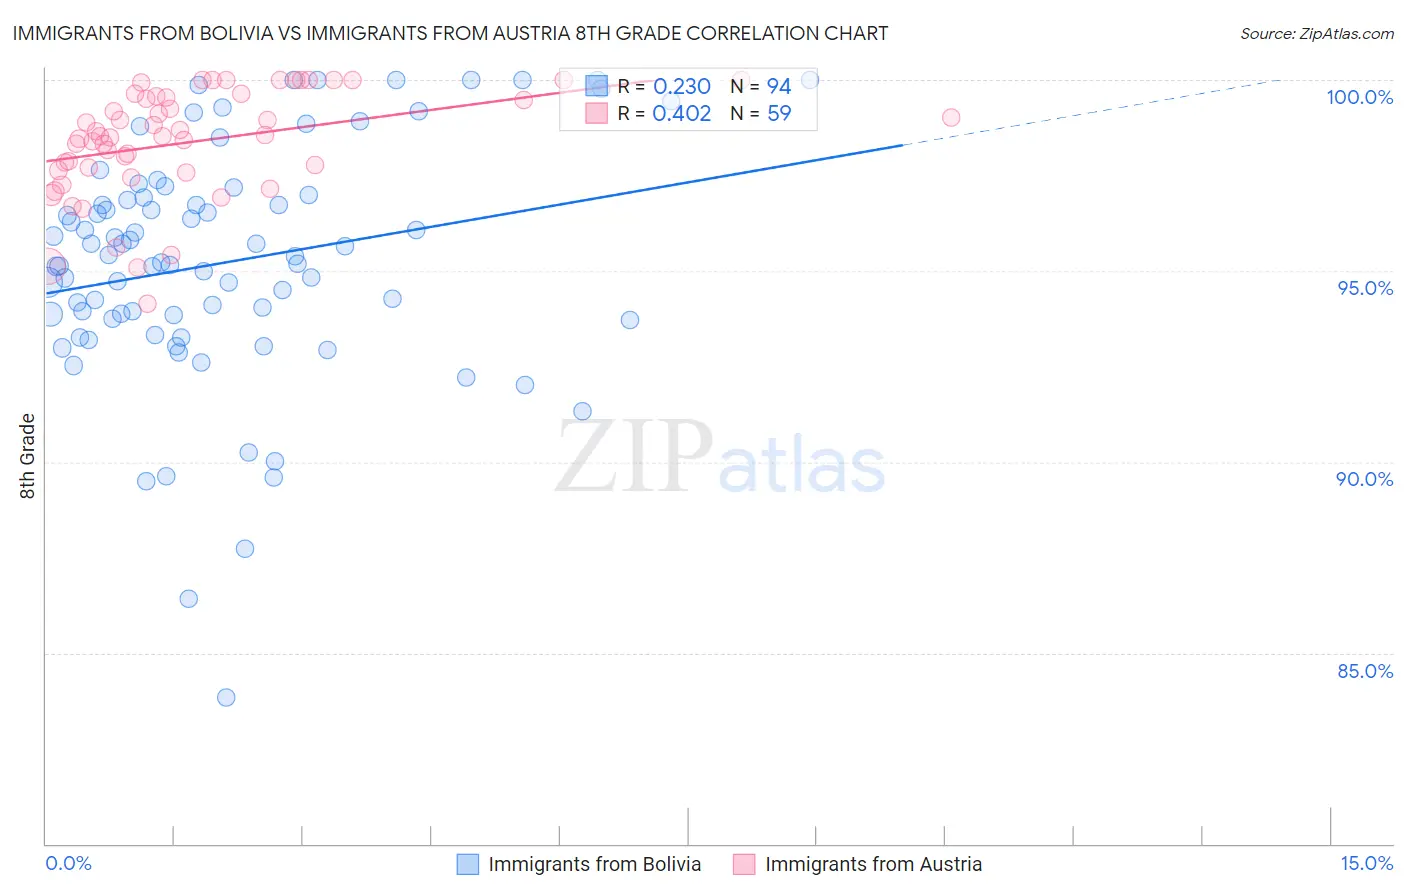
Immigrants from Bolivia vs Immigrants from Austria 8th Grade Correlation Chart
The statistical analysis conducted on geographies consisting of 158,727,163 people shows a weak positive correlation between the proportion of Immigrants from Bolivia and percentage of population with at least 8th grade education in the United States with a correlation coefficient (R) of 0.230 and weighted average of 94.6%. Similarly, the statistical analysis conducted on geographies consisting of 167,973,800 people shows a moderate positive correlation between the proportion of Immigrants from Austria and percentage of population with at least 8th grade education in the United States with a correlation coefficient (R) of 0.402 and weighted average of 96.7%, a difference of 2.2%.
8th Grade Correlation Summary
| Measurement | Immigrants from Bolivia | Immigrants from Austria |
| Minimum | 83.8% | 94.1% |
| Maximum | 100.0% | 100.0% |
| Range | 16.2% | 5.9% |
| Mean | 95.2% | 98.4% |
| Median | 95.3% | 98.5% |
| Interquartile 25% (IQ1) | 93.7% | 97.6% |
| Interquartile 75% (IQ3) | 96.9% | 99.6% |
| Interquartile Range (IQR) | 3.2% | 1.9% |
| Standard Deviation (Sample) | 3.1% | 1.4% |
| Standard Deviation (Population) | 3.1% | 1.4% |
Similar Demographics by 8th Grade
Demographics Similar to Immigrants from Bolivia by 8th Grade
In terms of 8th grade, the demographic groups most similar to Immigrants from Bolivia are Barbadian (94.6%, a difference of 0.0%), Immigrants from Trinidad and Tobago (94.6%, a difference of 0.010%), Armenian (94.7%, a difference of 0.020%), Taiwanese (94.7%, a difference of 0.040%), and Immigrants from Eritrea (94.6%, a difference of 0.040%).
| Demographics | Rating | Rank | 8th Grade |
| Trinidadians and Tobagonians | 0.2 /100 | #274 | Tragic 94.7% |
| Immigrants | Colombia | 0.2 /100 | #275 | Tragic 94.7% |
| Peruvians | 0.1 /100 | #276 | Tragic 94.7% |
| Taiwanese | 0.1 /100 | #277 | Tragic 94.7% |
| Armenians | 0.1 /100 | #278 | Tragic 94.7% |
| Immigrants | Trinidad and Tobago | 0.1 /100 | #279 | Tragic 94.6% |
| Barbadians | 0.1 /100 | #280 | Tragic 94.6% |
| Immigrants | Bolivia | 0.1 /100 | #281 | Tragic 94.6% |
| Immigrants | Eritrea | 0.1 /100 | #282 | Tragic 94.6% |
| Immigrants | St. Vincent and the Grenadines | 0.1 /100 | #283 | Tragic 94.6% |
| Immigrants | Philippines | 0.1 /100 | #284 | Tragic 94.6% |
| Immigrants | Barbados | 0.0 /100 | #285 | Tragic 94.5% |
| Immigrants | Peru | 0.0 /100 | #286 | Tragic 94.5% |
| Tohono O'odham | 0.0 /100 | #287 | Tragic 94.5% |
| Malaysians | 0.0 /100 | #288 | Tragic 94.5% |
Demographics Similar to Immigrants from Austria by 8th Grade
In terms of 8th grade, the demographic groups most similar to Immigrants from Austria are Immigrants from Northern Europe (96.7%, a difference of 0.0%), Immigrants from North America (96.7%, a difference of 0.010%), White/Caucasian (96.7%, a difference of 0.010%), Immigrants from Canada (96.7%, a difference of 0.020%), and Ukrainian (96.7%, a difference of 0.030%).
| Demographics | Rating | Rank | 8th Grade |
| Serbians | 99.8 /100 | #54 | Exceptional 96.7% |
| Russians | 99.8 /100 | #55 | Exceptional 96.7% |
| Australians | 99.8 /100 | #56 | Exceptional 96.7% |
| Macedonians | 99.8 /100 | #57 | Exceptional 96.7% |
| Immigrants | Canada | 99.8 /100 | #58 | Exceptional 96.7% |
| Immigrants | North America | 99.8 /100 | #59 | Exceptional 96.7% |
| Immigrants | Northern Europe | 99.8 /100 | #60 | Exceptional 96.7% |
| Immigrants | Austria | 99.8 /100 | #61 | Exceptional 96.7% |
| Whites/Caucasians | 99.8 /100 | #62 | Exceptional 96.7% |
| Ukrainians | 99.7 /100 | #63 | Exceptional 96.7% |
| Immigrants | India | 99.7 /100 | #64 | Exceptional 96.6% |
| Native Hawaiians | 99.7 /100 | #65 | Exceptional 96.6% |
| Canadians | 99.7 /100 | #66 | Exceptional 96.6% |
| Iranians | 99.7 /100 | #67 | Exceptional 96.6% |
| Creek | 99.7 /100 | #68 | Exceptional 96.6% |