Immigrants from Belize vs Immigrants from Italy Doctorate Degree
COMPARE
Immigrants from Belize
Immigrants from Italy
Doctorate Degree
Doctorate Degree Comparison
Immigrants from Belize
Immigrants from Italy
1.3%
DOCTORATE DEGREE
0.1/ 100
METRIC RATING
323rd/ 347
METRIC RANK
2.1%
DOCTORATE DEGREE
96.9/ 100
METRIC RATING
113th/ 347
METRIC RANK
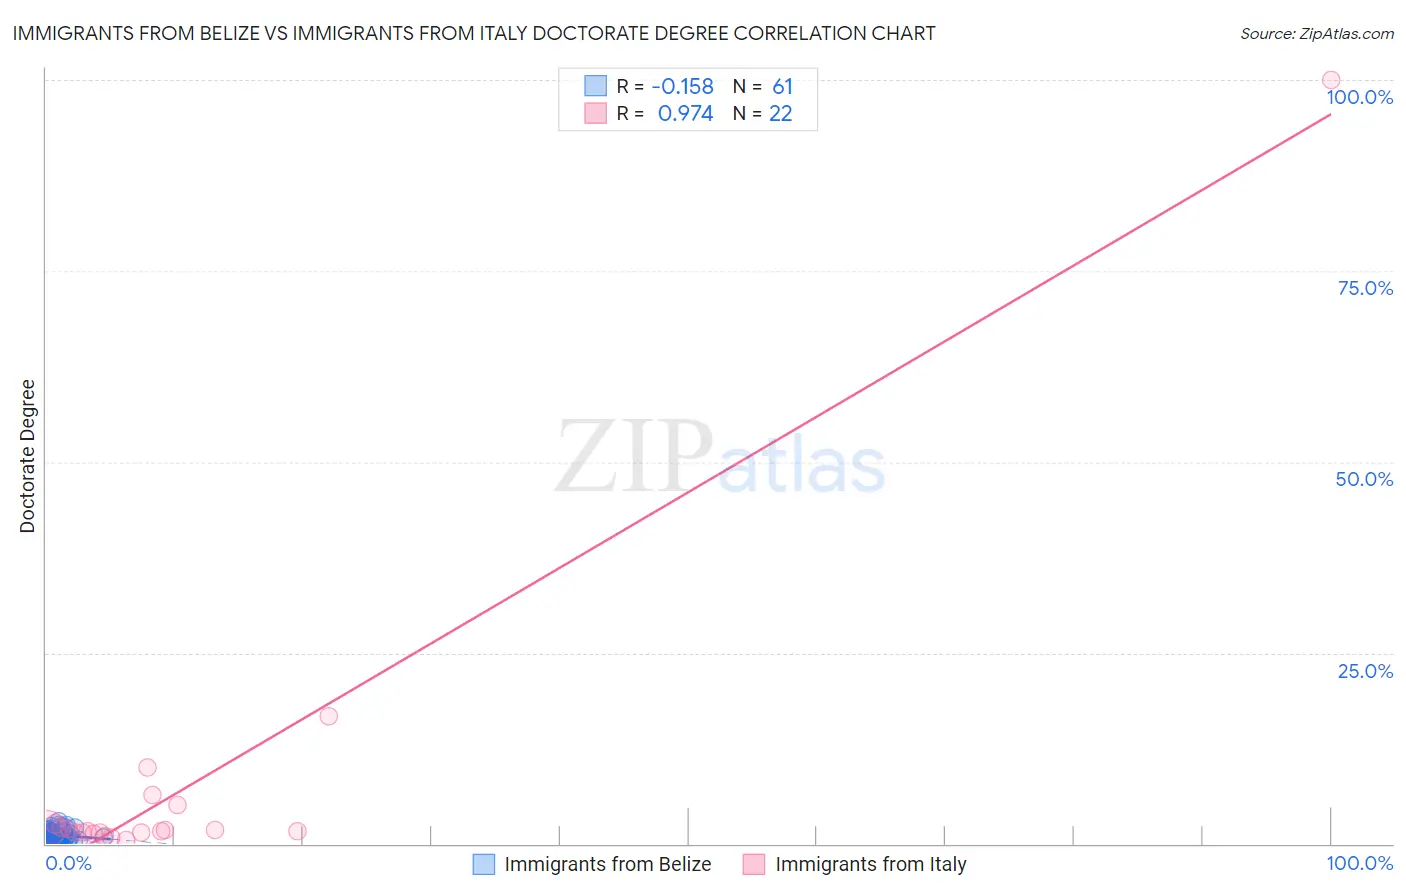
Immigrants from Belize vs Immigrants from Italy Doctorate Degree Correlation Chart
The statistical analysis conducted on geographies consisting of 129,933,258 people shows a poor negative correlation between the proportion of Immigrants from Belize and percentage of population with at least doctorate degree education in the United States with a correlation coefficient (R) of -0.158 and weighted average of 1.3%. Similarly, the statistical analysis conducted on geographies consisting of 322,534,686 people shows a perfect positive correlation between the proportion of Immigrants from Italy and percentage of population with at least doctorate degree education in the United States with a correlation coefficient (R) of 0.974 and weighted average of 2.1%, a difference of 55.9%.
Doctorate Degree Correlation Summary
| Measurement | Immigrants from Belize | Immigrants from Italy |
| Minimum | 0.14% | 0.55% |
| Maximum | 2.9% | 100.0% |
| Range | 2.7% | 99.5% |
| Mean | 1.1% | 7.5% |
| Median | 1.0% | 1.7% |
| Interquartile 25% (IQ1) | 0.66% | 1.4% |
| Interquartile 75% (IQ3) | 1.5% | 2.6% |
| Interquartile Range (IQR) | 0.82% | 1.2% |
| Standard Deviation (Sample) | 0.62% | 21.0% |
| Standard Deviation (Population) | 0.62% | 20.5% |
Similar Demographics by Doctorate Degree
Demographics Similar to Immigrants from Belize by Doctorate Degree
In terms of doctorate degree, the demographic groups most similar to Immigrants from Belize are Seminole (1.3%, a difference of 0.20%), Dutch West Indian (1.3%, a difference of 0.26%), Native/Alaskan (1.3%, a difference of 0.32%), Immigrants from St. Vincent and the Grenadines (1.3%, a difference of 0.36%), and Immigrants from Guyana (1.3%, a difference of 0.43%).
| Demographics | Rating | Rank | Doctorate Degree |
| Navajo | 0.1 /100 | #316 | Tragic 1.4% |
| Immigrants | Micronesia | 0.1 /100 | #317 | Tragic 1.3% |
| Creek | 0.1 /100 | #318 | Tragic 1.3% |
| Immigrants | Guyana | 0.1 /100 | #319 | Tragic 1.3% |
| Immigrants | St. Vincent and the Grenadines | 0.1 /100 | #320 | Tragic 1.3% |
| Dutch West Indians | 0.1 /100 | #321 | Tragic 1.3% |
| Seminole | 0.1 /100 | #322 | Tragic 1.3% |
| Immigrants | Belize | 0.1 /100 | #323 | Tragic 1.3% |
| Natives/Alaskans | 0.0 /100 | #324 | Tragic 1.3% |
| Pima | 0.0 /100 | #325 | Tragic 1.3% |
| Immigrants | Cabo Verde | 0.0 /100 | #326 | Tragic 1.3% |
| Hispanics or Latinos | 0.0 /100 | #327 | Tragic 1.3% |
| Inupiat | 0.0 /100 | #328 | Tragic 1.3% |
| Haitians | 0.0 /100 | #329 | Tragic 1.3% |
| Yup'ik | 0.0 /100 | #330 | Tragic 1.3% |
Demographics Similar to Immigrants from Italy by Doctorate Degree
In terms of doctorate degree, the demographic groups most similar to Immigrants from Italy are Immigrants from Croatia (2.1%, a difference of 0.15%), Syrian (2.1%, a difference of 0.21%), Immigrants from Pakistan (2.1%, a difference of 0.23%), Taiwanese (2.1%, a difference of 0.23%), and Brazilian (2.1%, a difference of 0.29%).
| Demographics | Rating | Rank | Doctorate Degree |
| Sudanese | 97.7 /100 | #106 | Exceptional 2.1% |
| Europeans | 97.5 /100 | #107 | Exceptional 2.1% |
| Immigrants | Germany | 97.3 /100 | #108 | Exceptional 2.1% |
| Ukrainians | 97.2 /100 | #109 | Exceptional 2.1% |
| Brazilians | 97.2 /100 | #110 | Exceptional 2.1% |
| Immigrants | Pakistan | 97.1 /100 | #111 | Exceptional 2.1% |
| Syrians | 97.1 /100 | #112 | Exceptional 2.1% |
| Immigrants | Italy | 96.9 /100 | #113 | Exceptional 2.1% |
| Immigrants | Croatia | 96.8 /100 | #114 | Exceptional 2.1% |
| Taiwanese | 96.7 /100 | #115 | Exceptional 2.1% |
| Maltese | 96.2 /100 | #116 | Exceptional 2.1% |
| Lebanese | 96.0 /100 | #117 | Exceptional 2.1% |
| Icelanders | 96.0 /100 | #118 | Exceptional 2.1% |
| Pakistanis | 95.8 /100 | #119 | Exceptional 2.0% |
| Immigrants | Morocco | 95.5 /100 | #120 | Exceptional 2.0% |