Immigrants from Belgium vs Immigrants from Burma/Myanmar Disability Age Over 75
COMPARE
Immigrants from Belgium
Immigrants from Burma/Myanmar
Disability Age Over 75
Disability Age Over 75 Comparison
Immigrants from Belgium
Immigrants from Burma/Myanmar
45.3%
DISABILITY AGE OVER 75
100.0/ 100
METRIC RATING
21st/ 347
METRIC RANK
47.9%
DISABILITY AGE OVER 75
11.7/ 100
METRIC RATING
212th/ 347
METRIC RANK
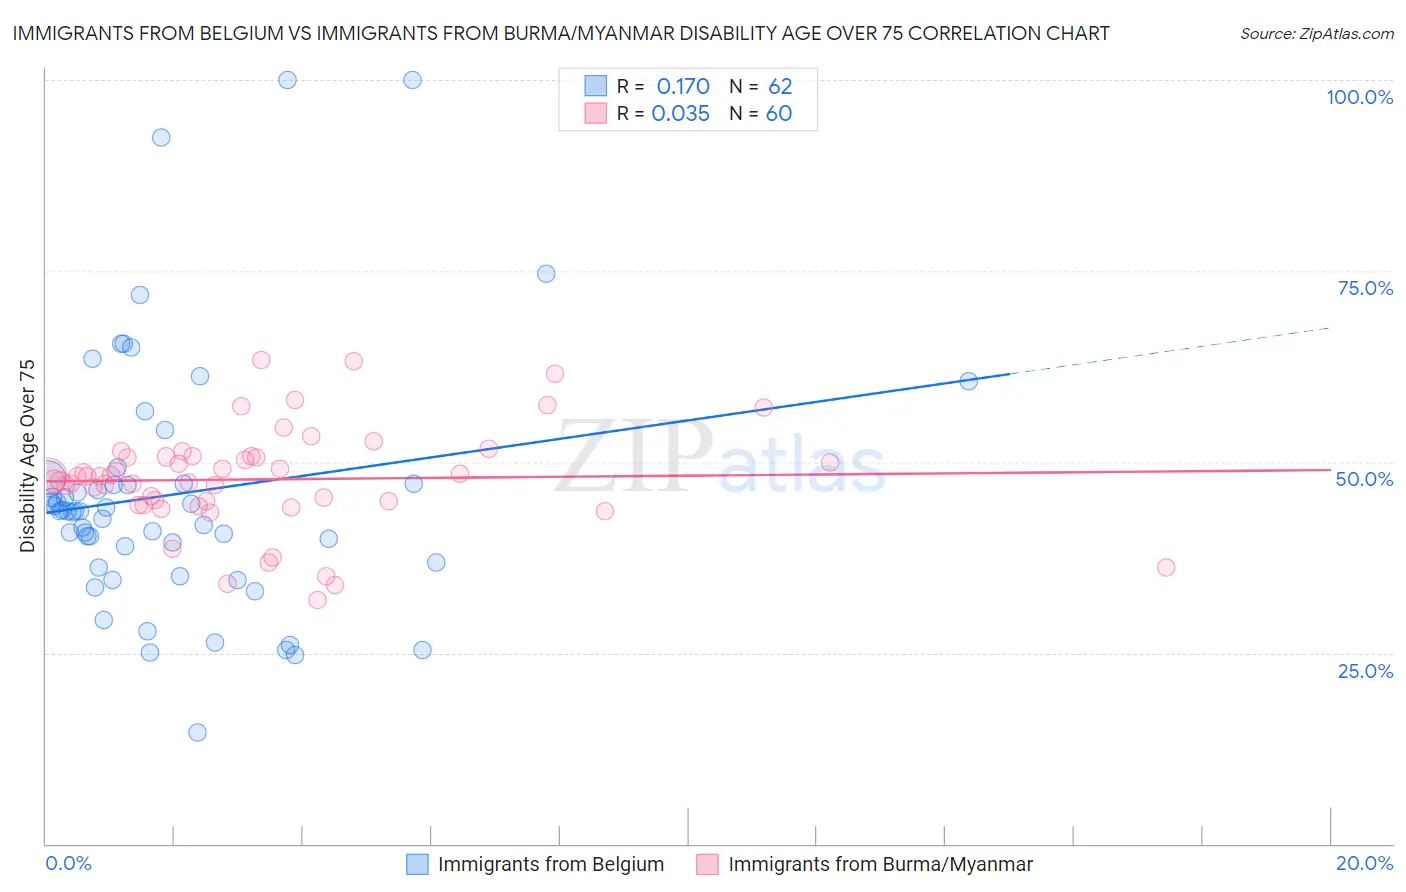
Immigrants from Belgium vs Immigrants from Burma/Myanmar Disability Age Over 75 Correlation Chart
The statistical analysis conducted on geographies consisting of 146,642,839 people shows a poor positive correlation between the proportion of Immigrants from Belgium and percentage of population with a disability over the age of 75 in the United States with a correlation coefficient (R) of 0.170 and weighted average of 45.3%. Similarly, the statistical analysis conducted on geographies consisting of 172,144,400 people shows no correlation between the proportion of Immigrants from Burma/Myanmar and percentage of population with a disability over the age of 75 in the United States with a correlation coefficient (R) of 0.035 and weighted average of 47.9%, a difference of 5.7%.
Disability Age Over 75 Correlation Summary
| Measurement | Immigrants from Belgium | Immigrants from Burma/Myanmar |
| Minimum | 14.6% | 32.0% |
| Maximum | 100.0% | 63.4% |
| Range | 85.4% | 31.4% |
| Mean | 45.8% | 47.7% |
| Median | 43.6% | 48.1% |
| Interquartile 25% (IQ1) | 36.9% | 44.6% |
| Interquartile 75% (IQ3) | 47.1% | 50.7% |
| Interquartile Range (IQR) | 10.2% | 6.1% |
| Standard Deviation (Sample) | 16.7% | 6.7% |
| Standard Deviation (Population) | 16.5% | 6.6% |
Similar Demographics by Disability Age Over 75
Demographics Similar to Immigrants from Belgium by Disability Age Over 75
In terms of disability age over 75, the demographic groups most similar to Immigrants from Belgium are Immigrants from South Africa (45.3%, a difference of 0.030%), Immigrants from Switzerland (45.3%, a difference of 0.060%), Polish (45.3%, a difference of 0.080%), Immigrants from Bolivia (45.4%, a difference of 0.12%), and Immigrants from Serbia (45.3%, a difference of 0.13%).
| Demographics | Rating | Rank | Disability Age Over 75 |
| Immigrants | Scotland | 100.0 /100 | #14 | Exceptional 45.1% |
| Immigrants | Sweden | 100.0 /100 | #15 | Exceptional 45.1% |
| Immigrants | Northern Europe | 100.0 /100 | #16 | Exceptional 45.2% |
| Immigrants | India | 100.0 /100 | #17 | Exceptional 45.2% |
| Bolivians | 100.0 /100 | #18 | Exceptional 45.2% |
| Immigrants | Greece | 100.0 /100 | #19 | Exceptional 45.2% |
| Immigrants | Serbia | 100.0 /100 | #20 | Exceptional 45.3% |
| Immigrants | Belgium | 100.0 /100 | #21 | Exceptional 45.3% |
| Immigrants | South Africa | 100.0 /100 | #22 | Exceptional 45.3% |
| Immigrants | Switzerland | 99.9 /100 | #23 | Exceptional 45.3% |
| Poles | 99.9 /100 | #24 | Exceptional 45.3% |
| Immigrants | Bolivia | 99.9 /100 | #25 | Exceptional 45.4% |
| Macedonians | 99.9 /100 | #26 | Exceptional 45.4% |
| Immigrants | Poland | 99.9 /100 | #27 | Exceptional 45.4% |
| Thais | 99.9 /100 | #28 | Exceptional 45.4% |
Demographics Similar to Immigrants from Burma/Myanmar by Disability Age Over 75
In terms of disability age over 75, the demographic groups most similar to Immigrants from Burma/Myanmar are Panamanian (47.9%, a difference of 0.0%), Vietnamese (47.9%, a difference of 0.010%), Laotian (47.9%, a difference of 0.010%), Immigrants from Barbados (47.9%, a difference of 0.060%), and Senegalese (47.9%, a difference of 0.060%).
| Demographics | Rating | Rank | Disability Age Over 75 |
| Immigrants | Ghana | 19.1 /100 | #205 | Poor 47.7% |
| Jamaicans | 19.0 /100 | #206 | Poor 47.7% |
| Immigrants | Syria | 17.4 /100 | #207 | Poor 47.8% |
| Immigrants | Senegal | 16.9 /100 | #208 | Poor 47.8% |
| Immigrants | Indonesia | 14.2 /100 | #209 | Poor 47.8% |
| Vietnamese | 11.9 /100 | #210 | Poor 47.9% |
| Panamanians | 11.8 /100 | #211 | Poor 47.9% |
| Immigrants | Burma/Myanmar | 11.7 /100 | #212 | Poor 47.9% |
| Laotians | 11.5 /100 | #213 | Poor 47.9% |
| Immigrants | Barbados | 10.7 /100 | #214 | Poor 47.9% |
| Senegalese | 10.7 /100 | #215 | Poor 47.9% |
| Immigrants | Panama | 10.2 /100 | #216 | Poor 47.9% |
| Immigrants | Grenada | 9.4 /100 | #217 | Tragic 47.9% |
| Immigrants | Western Africa | 8.3 /100 | #218 | Tragic 48.0% |
| Immigrants | Western Asia | 7.5 /100 | #219 | Tragic 48.0% |