Immigrants from Belarus vs American 4th Grade
COMPARE
Immigrants from Belarus
American
4th Grade
4th Grade Comparison
Immigrants from Belarus
Americans
97.5%
4TH GRADE
55.8/ 100
METRIC RATING
168th/ 347
METRIC RANK
98.1%
4TH GRADE
99.8/ 100
METRIC RATING
59th/ 347
METRIC RANK
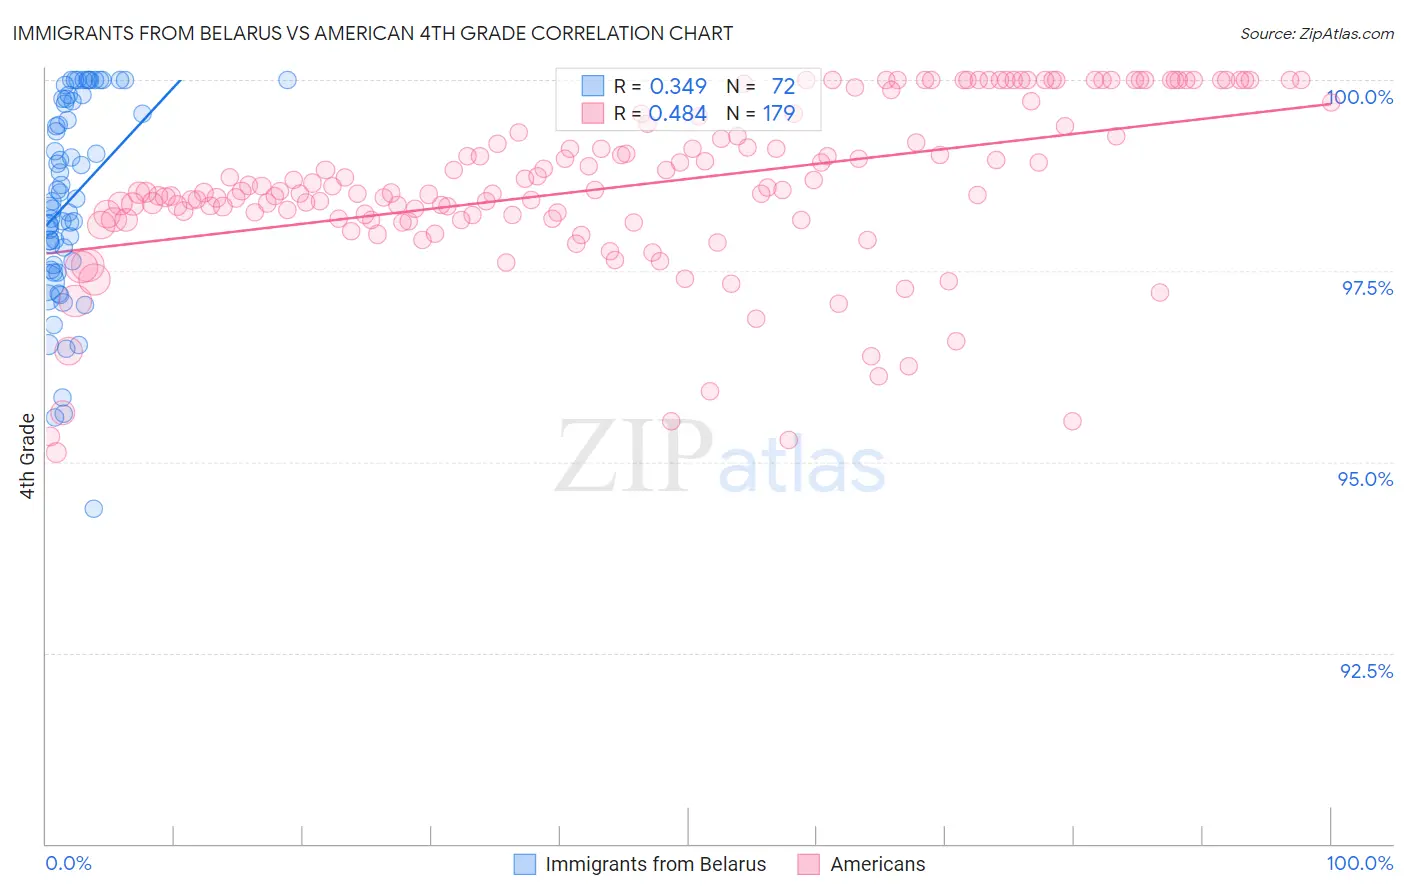
Immigrants from Belarus vs American 4th Grade Correlation Chart
The statistical analysis conducted on geographies consisting of 149,993,317 people shows a mild positive correlation between the proportion of Immigrants from Belarus and percentage of population with at least 4th grade education in the United States with a correlation coefficient (R) of 0.349 and weighted average of 97.5%. Similarly, the statistical analysis conducted on geographies consisting of 581,990,776 people shows a moderate positive correlation between the proportion of Americans and percentage of population with at least 4th grade education in the United States with a correlation coefficient (R) of 0.484 and weighted average of 98.1%, a difference of 0.55%.
4th Grade Correlation Summary
| Measurement | Immigrants from Belarus | American |
| Minimum | 94.4% | 95.1% |
| Maximum | 100.0% | 100.0% |
| Range | 5.6% | 4.9% |
| Mean | 98.5% | 98.6% |
| Median | 98.4% | 98.5% |
| Interquartile 25% (IQ1) | 97.6% | 98.2% |
| Interquartile 75% (IQ3) | 99.7% | 99.4% |
| Interquartile Range (IQR) | 2.1% | 1.3% |
| Standard Deviation (Sample) | 1.3% | 1.1% |
| Standard Deviation (Population) | 1.3% | 1.1% |
Similar Demographics by 4th Grade
Demographics Similar to Immigrants from Belarus by 4th Grade
In terms of 4th grade, the demographic groups most similar to Immigrants from Belarus are Kenyan (97.5%, a difference of 0.0%), Immigrants from Poland (97.5%, a difference of 0.0%), Ugandan (97.6%, a difference of 0.010%), Venezuelan (97.6%, a difference of 0.010%), and Chilean (97.5%, a difference of 0.010%).
| Demographics | Rating | Rank | 4th Grade |
| Marshallese | 60.8 /100 | #161 | Good 97.6% |
| Bermudans | 60.5 /100 | #162 | Good 97.6% |
| Immigrants | Iran | 60.3 /100 | #163 | Good 97.6% |
| Ugandans | 58.9 /100 | #164 | Average 97.6% |
| Venezuelans | 58.7 /100 | #165 | Average 97.6% |
| Kenyans | 56.5 /100 | #166 | Average 97.5% |
| Immigrants | Poland | 55.9 /100 | #167 | Average 97.5% |
| Immigrants | Belarus | 55.8 /100 | #168 | Average 97.5% |
| Chileans | 54.4 /100 | #169 | Average 97.5% |
| Immigrants | Spain | 51.8 /100 | #170 | Average 97.5% |
| Brazilians | 51.5 /100 | #171 | Average 97.5% |
| Immigrants | Sri Lanka | 51.1 /100 | #172 | Average 97.5% |
| Immigrants | Korea | 50.6 /100 | #173 | Average 97.5% |
| Egyptians | 50.0 /100 | #174 | Average 97.5% |
| Immigrants | Micronesia | 49.6 /100 | #175 | Average 97.5% |
Demographics Similar to Americans by 4th Grade
In terms of 4th grade, the demographic groups most similar to Americans are Maltese (98.1%, a difference of 0.010%), White/Caucasian (98.1%, a difference of 0.010%), Greek (98.1%, a difference of 0.010%), Austrian (98.1%, a difference of 0.010%), and Creek (98.1%, a difference of 0.010%).
| Demographics | Rating | Rank | 4th Grade |
| Australians | 99.8 /100 | #52 | Exceptional 98.1% |
| Slavs | 99.8 /100 | #53 | Exceptional 98.1% |
| Maltese | 99.8 /100 | #54 | Exceptional 98.1% |
| Whites/Caucasians | 99.8 /100 | #55 | Exceptional 98.1% |
| Greeks | 99.8 /100 | #56 | Exceptional 98.1% |
| Austrians | 99.8 /100 | #57 | Exceptional 98.1% |
| Creek | 99.8 /100 | #58 | Exceptional 98.1% |
| Americans | 99.8 /100 | #59 | Exceptional 98.1% |
| Immigrants | Canada | 99.7 /100 | #60 | Exceptional 98.1% |
| Immigrants | North America | 99.7 /100 | #61 | Exceptional 98.1% |
| Serbians | 99.7 /100 | #62 | Exceptional 98.1% |
| Russians | 99.7 /100 | #63 | Exceptional 98.0% |
| Cajuns | 99.7 /100 | #64 | Exceptional 98.0% |
| Immigrants | Northern Europe | 99.6 /100 | #65 | Exceptional 98.0% |
| Canadians | 99.6 /100 | #66 | Exceptional 98.0% |