Moroccan vs Somali 4th Grade
COMPARE
Moroccan
Somali
4th Grade
4th Grade Comparison
Moroccans
Somalis
97.3%
4TH GRADE
11.3/ 100
METRIC RATING
207th/ 347
METRIC RANK
96.6%
4TH GRADE
0.0/ 100
METRIC RATING
296th/ 347
METRIC RANK
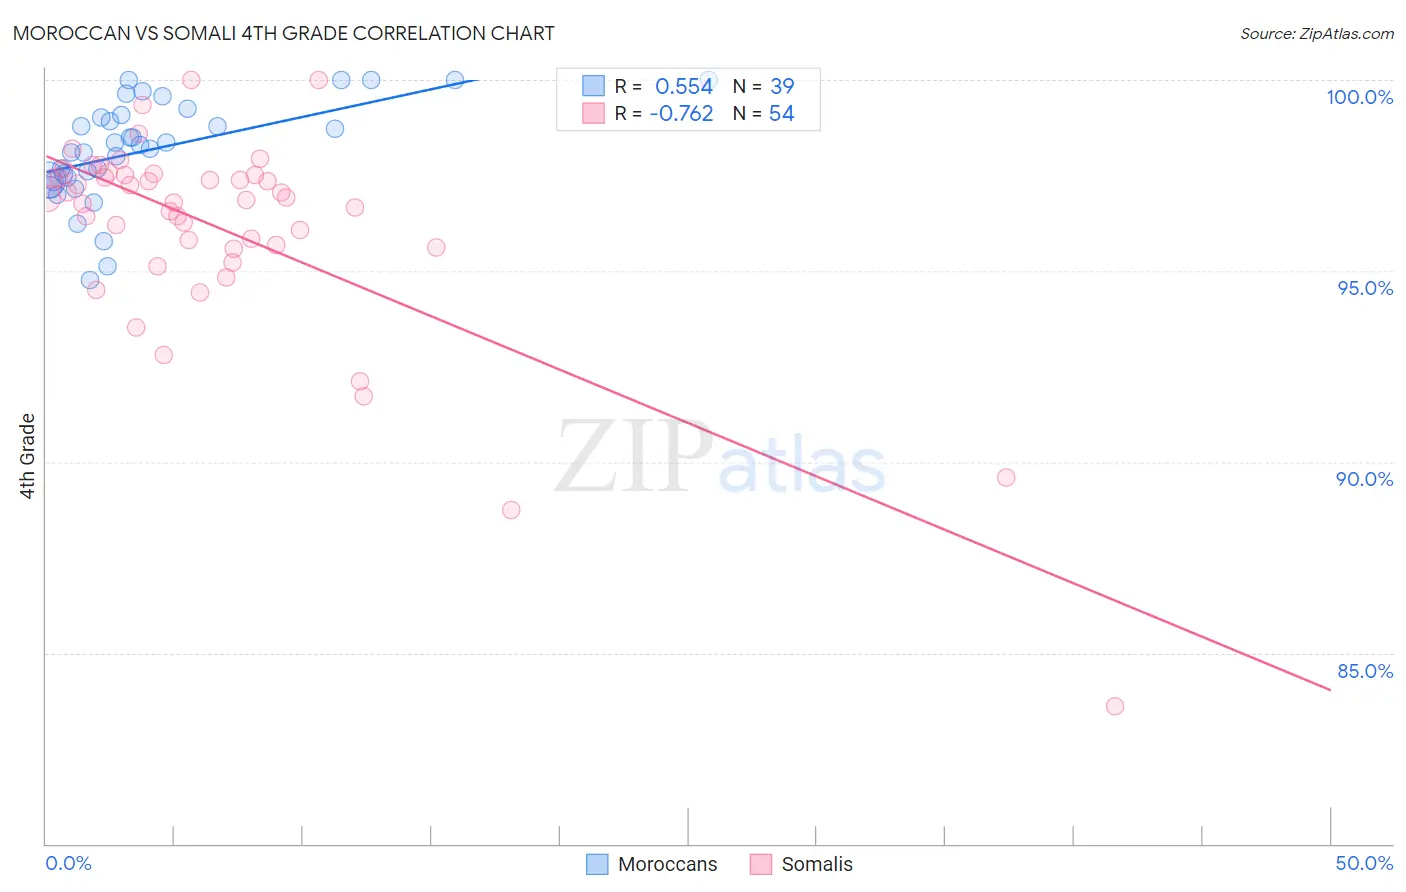
Moroccan vs Somali 4th Grade Correlation Chart
The statistical analysis conducted on geographies consisting of 201,817,667 people shows a substantial positive correlation between the proportion of Moroccans and percentage of population with at least 4th grade education in the United States with a correlation coefficient (R) of 0.554 and weighted average of 97.3%. Similarly, the statistical analysis conducted on geographies consisting of 99,332,457 people shows a strong negative correlation between the proportion of Somalis and percentage of population with at least 4th grade education in the United States with a correlation coefficient (R) of -0.762 and weighted average of 96.6%, a difference of 0.72%.
4th Grade Correlation Summary
| Measurement | Moroccan | Somali |
| Minimum | 94.8% | 83.6% |
| Maximum | 100.0% | 100.0% |
| Range | 5.2% | 16.4% |
| Mean | 98.2% | 96.1% |
| Median | 98.3% | 96.9% |
| Interquartile 25% (IQ1) | 97.4% | 95.6% |
| Interquartile 75% (IQ3) | 99.1% | 97.5% |
| Interquartile Range (IQR) | 1.7% | 1.9% |
| Standard Deviation (Sample) | 1.3% | 2.8% |
| Standard Deviation (Population) | 1.3% | 2.8% |
Similar Demographics by 4th Grade
Demographics Similar to Moroccans by 4th Grade
In terms of 4th grade, the demographic groups most similar to Moroccans are Immigrants from Zaire (97.3%, a difference of 0.010%), Immigrants from Bahamas (97.3%, a difference of 0.010%), Paiute (97.3%, a difference of 0.020%), Laotian (97.3%, a difference of 0.020%), and Immigrants from Oceania (97.3%, a difference of 0.020%).
| Demographics | Rating | Rank | 4th Grade |
| Immigrants | Uganda | 19.8 /100 | #200 | Poor 97.4% |
| Immigrants | Southern Europe | 16.2 /100 | #201 | Poor 97.4% |
| Immigrants | Chile | 16.1 /100 | #202 | Poor 97.4% |
| Immigrants | Northern Africa | 15.1 /100 | #203 | Poor 97.4% |
| Africans | 14.6 /100 | #204 | Poor 97.4% |
| Paiute | 13.2 /100 | #205 | Poor 97.3% |
| Immigrants | Zaire | 12.8 /100 | #206 | Poor 97.3% |
| Moroccans | 11.3 /100 | #207 | Poor 97.3% |
| Immigrants | Bahamas | 10.8 /100 | #208 | Poor 97.3% |
| Laotians | 9.3 /100 | #209 | Tragic 97.3% |
| Immigrants | Oceania | 9.1 /100 | #210 | Tragic 97.3% |
| Sudanese | 9.0 /100 | #211 | Tragic 97.3% |
| Tohono O'odham | 8.4 /100 | #212 | Tragic 97.3% |
| Costa Ricans | 8.3 /100 | #213 | Tragic 97.3% |
| Immigrants | Nepal | 7.7 /100 | #214 | Tragic 97.3% |
Demographics Similar to Somalis by 4th Grade
In terms of 4th grade, the demographic groups most similar to Somalis are Immigrants from Portugal (96.6%, a difference of 0.010%), Immigrants from Eritrea (96.7%, a difference of 0.030%), Puerto Rican (96.7%, a difference of 0.050%), Malaysian (96.7%, a difference of 0.070%), and Immigrants from Grenada (96.7%, a difference of 0.080%).
| Demographics | Rating | Rank | 4th Grade |
| Immigrants | West Indies | 0.0 /100 | #289 | Tragic 96.7% |
| British West Indians | 0.0 /100 | #290 | Tragic 96.7% |
| Immigrants | Grenada | 0.0 /100 | #291 | Tragic 96.7% |
| Malaysians | 0.0 /100 | #292 | Tragic 96.7% |
| Puerto Ricans | 0.0 /100 | #293 | Tragic 96.7% |
| Immigrants | Eritrea | 0.0 /100 | #294 | Tragic 96.7% |
| Immigrants | Portugal | 0.0 /100 | #295 | Tragic 96.6% |
| Somalis | 0.0 /100 | #296 | Tragic 96.6% |
| Immigrants | Somalia | 0.0 /100 | #297 | Tragic 96.5% |
| Haitians | 0.0 /100 | #298 | Tragic 96.5% |
| Immigrants | Dominica | 0.0 /100 | #299 | Tragic 96.5% |
| Immigrants | South Eastern Asia | 0.0 /100 | #300 | Tragic 96.5% |
| Immigrants | Immigrants | 0.0 /100 | #301 | Tragic 96.5% |
| Immigrants | Cuba | 0.0 /100 | #302 | Tragic 96.4% |
| Guyanese | 0.0 /100 | #303 | Tragic 96.4% |