Salvadoran vs Korean 11th Grade
COMPARE
Salvadoran
Korean
11th Grade
11th Grade Comparison
Salvadorans
Koreans
86.2%
11TH GRADE
0.0/ 100
METRIC RATING
340th/ 347
METRIC RANK
92.1%
11TH GRADE
14.4/ 100
METRIC RATING
212th/ 347
METRIC RANK
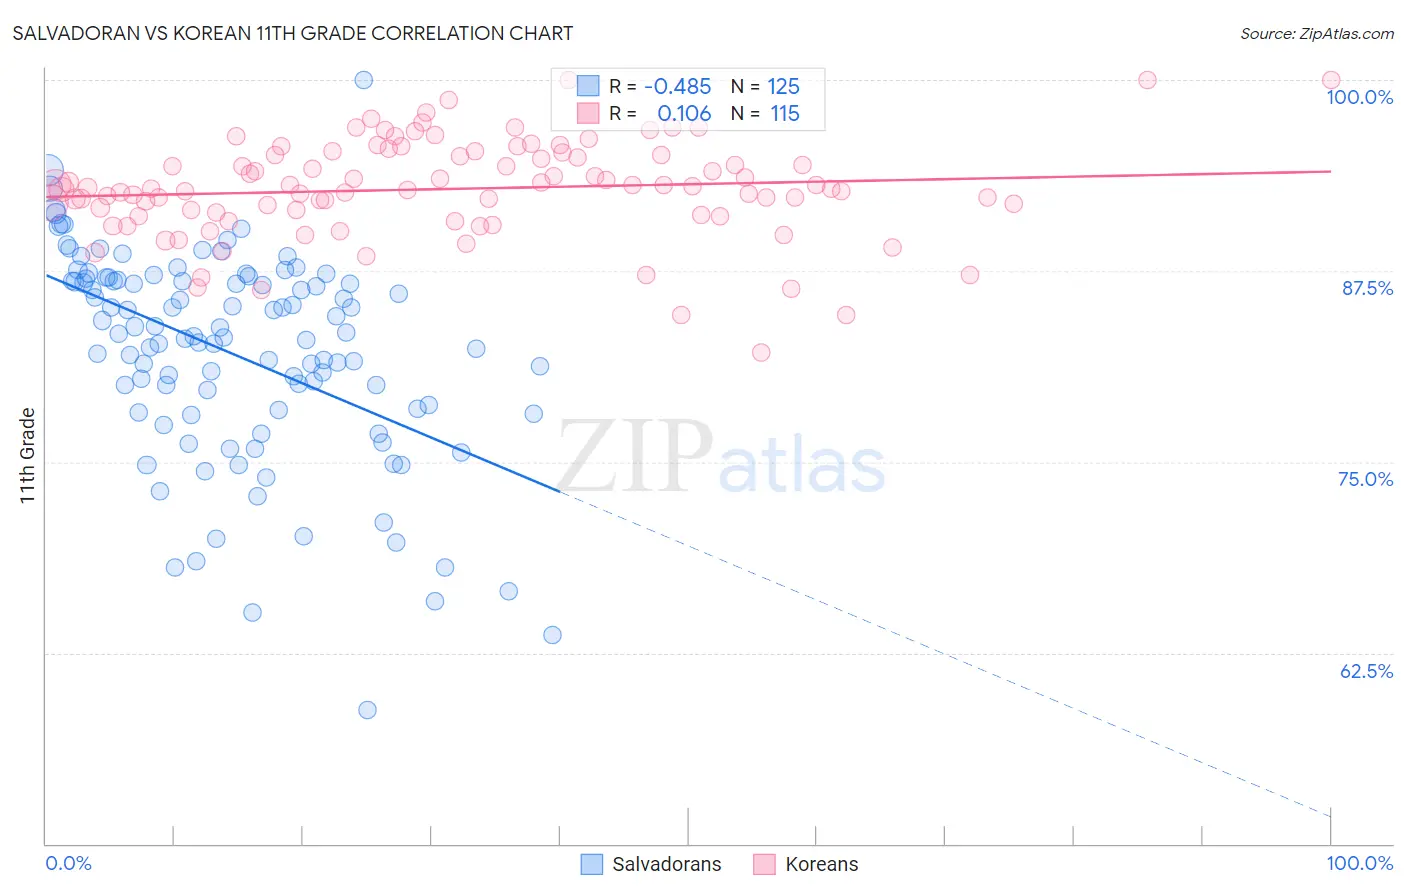
Salvadoran vs Korean 11th Grade Correlation Chart
The statistical analysis conducted on geographies consisting of 399,020,036 people shows a moderate negative correlation between the proportion of Salvadorans and percentage of population with at least 11th grade education in the United States with a correlation coefficient (R) of -0.485 and weighted average of 86.2%. Similarly, the statistical analysis conducted on geographies consisting of 510,943,943 people shows a poor positive correlation between the proportion of Koreans and percentage of population with at least 11th grade education in the United States with a correlation coefficient (R) of 0.106 and weighted average of 92.1%, a difference of 6.9%.
11th Grade Correlation Summary
| Measurement | Salvadoran | Korean |
| Minimum | 58.8% | 82.2% |
| Maximum | 100.0% | 100.0% |
| Range | 41.2% | 17.8% |
| Mean | 82.1% | 92.9% |
| Median | 83.2% | 92.9% |
| Interquartile 25% (IQ1) | 78.3% | 91.1% |
| Interquartile 75% (IQ3) | 86.9% | 95.1% |
| Interquartile Range (IQR) | 8.6% | 3.9% |
| Standard Deviation (Sample) | 6.9% | 3.2% |
| Standard Deviation (Population) | 6.9% | 3.2% |
Similar Demographics by 11th Grade
Demographics Similar to Salvadorans by 11th Grade
In terms of 11th grade, the demographic groups most similar to Salvadorans are Mexican (86.1%, a difference of 0.060%), Guatemalan (86.4%, a difference of 0.23%), Immigrants from Guatemala (85.8%, a difference of 0.39%), Immigrants from Latin America (86.8%, a difference of 0.73%), and Immigrants from Dominican Republic (86.9%, a difference of 0.85%).
| Demographics | Rating | Rank | 11th Grade |
| Immigrants | Yemen | 0.0 /100 | #333 | Tragic 87.1% |
| Houma | 0.0 /100 | #334 | Tragic 87.0% |
| Central Americans | 0.0 /100 | #335 | Tragic 86.9% |
| Immigrants | Dominican Republic | 0.0 /100 | #336 | Tragic 86.9% |
| Immigrants | Honduras | 0.0 /100 | #337 | Tragic 86.9% |
| Immigrants | Latin America | 0.0 /100 | #338 | Tragic 86.8% |
| Guatemalans | 0.0 /100 | #339 | Tragic 86.4% |
| Salvadorans | 0.0 /100 | #340 | Tragic 86.2% |
| Mexicans | 0.0 /100 | #341 | Tragic 86.1% |
| Immigrants | Guatemala | 0.0 /100 | #342 | Tragic 85.8% |
| Immigrants | El Salvador | 0.0 /100 | #343 | Tragic 85.3% |
| Yakama | 0.0 /100 | #344 | Tragic 85.0% |
| Immigrants | Central America | 0.0 /100 | #345 | Tragic 84.9% |
| Spanish American Indians | 0.0 /100 | #346 | Tragic 84.7% |
| Immigrants | Mexico | 0.0 /100 | #347 | Tragic 84.5% |
Demographics Similar to Koreans by 11th Grade
In terms of 11th grade, the demographic groups most similar to Koreans are Immigrants from Ethiopia (92.1%, a difference of 0.010%), Afghan (92.1%, a difference of 0.030%), Immigrants from Southern Europe (92.1%, a difference of 0.040%), Immigrants from Micronesia (92.2%, a difference of 0.060%), and Somali (92.1%, a difference of 0.060%).
| Demographics | Rating | Rank | 11th Grade |
| Kiowa | 23.2 /100 | #205 | Fair 92.2% |
| Bolivians | 23.2 /100 | #206 | Fair 92.2% |
| Immigrants | Oceania | 22.4 /100 | #207 | Fair 92.2% |
| Colville | 21.8 /100 | #208 | Fair 92.2% |
| Tongans | 19.8 /100 | #209 | Poor 92.2% |
| Ethiopians | 18.8 /100 | #210 | Poor 92.2% |
| Immigrants | Micronesia | 17.7 /100 | #211 | Poor 92.2% |
| Koreans | 14.4 /100 | #212 | Poor 92.1% |
| Immigrants | Ethiopia | 13.9 /100 | #213 | Poor 92.1% |
| Afghans | 12.8 /100 | #214 | Poor 92.1% |
| Immigrants | Southern Europe | 12.5 /100 | #215 | Poor 92.1% |
| Somalis | 11.6 /100 | #216 | Poor 92.1% |
| Immigrants | Sierra Leone | 11.1 /100 | #217 | Poor 92.0% |
| Blackfeet | 10.1 /100 | #218 | Poor 92.0% |
| Portuguese | 10.0 /100 | #219 | Tragic 92.0% |