American vs Korean 11th Grade
COMPARE
American
Korean
11th Grade
11th Grade Comparison
Americans
Koreans
92.7%
11TH GRADE
71.7/ 100
METRIC RATING
159th/ 347
METRIC RANK
92.1%
11TH GRADE
14.4/ 100
METRIC RATING
212th/ 347
METRIC RANK
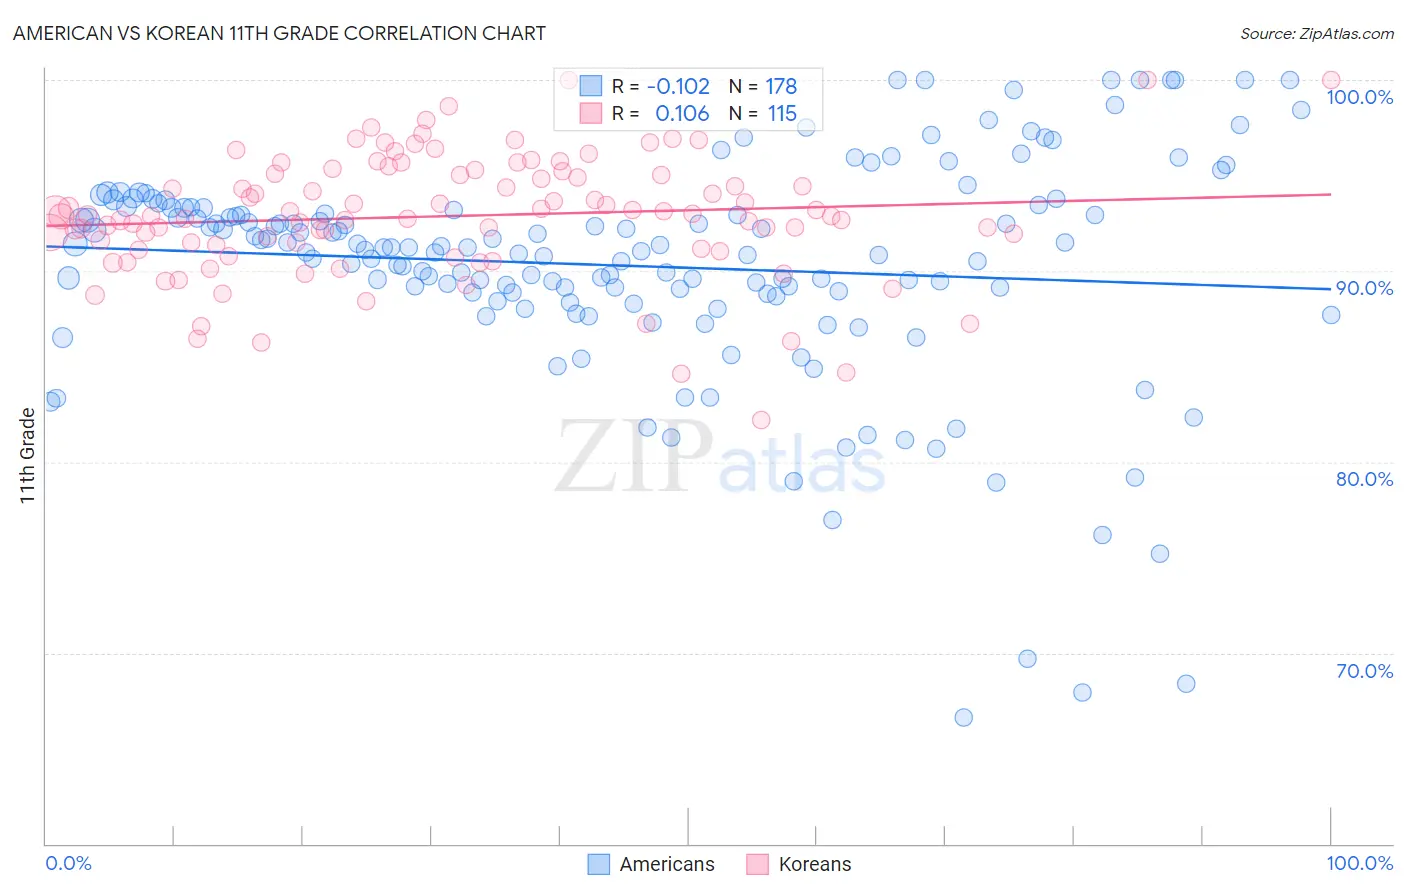
American vs Korean 11th Grade Correlation Chart
The statistical analysis conducted on geographies consisting of 581,994,413 people shows a poor negative correlation between the proportion of Americans and percentage of population with at least 11th grade education in the United States with a correlation coefficient (R) of -0.102 and weighted average of 92.7%. Similarly, the statistical analysis conducted on geographies consisting of 510,943,943 people shows a poor positive correlation between the proportion of Koreans and percentage of population with at least 11th grade education in the United States with a correlation coefficient (R) of 0.106 and weighted average of 92.1%, a difference of 0.67%.
11th Grade Correlation Summary
| Measurement | American | Korean |
| Minimum | 66.6% | 82.2% |
| Maximum | 100.0% | 100.0% |
| Range | 33.4% | 17.8% |
| Mean | 90.3% | 92.9% |
| Median | 91.2% | 92.9% |
| Interquartile 25% (IQ1) | 88.8% | 91.1% |
| Interquartile 75% (IQ3) | 93.3% | 95.1% |
| Interquartile Range (IQR) | 4.5% | 3.9% |
| Standard Deviation (Sample) | 5.9% | 3.2% |
| Standard Deviation (Population) | 5.9% | 3.2% |
Similar Demographics by 11th Grade
Demographics Similar to Americans by 11th Grade
In terms of 11th grade, the demographic groups most similar to Americans are Immigrants from Venezuela (92.7%, a difference of 0.0%), Immigrants from Eastern Asia (92.7%, a difference of 0.010%), Immigrants from Lebanon (92.7%, a difference of 0.010%), Osage (92.7%, a difference of 0.020%), and Argentinean (92.7%, a difference of 0.020%).
| Demographics | Rating | Rank | 11th Grade |
| Iraqis | 74.2 /100 | #152 | Good 92.8% |
| Brazilians | 73.9 /100 | #153 | Good 92.8% |
| Osage | 73.4 /100 | #154 | Good 92.7% |
| Argentineans | 73.4 /100 | #155 | Good 92.7% |
| Immigrants | Spain | 73.0 /100 | #156 | Good 92.7% |
| Immigrants | Eastern Asia | 72.6 /100 | #157 | Good 92.7% |
| Immigrants | Venezuela | 72.0 /100 | #158 | Good 92.7% |
| Americans | 71.7 /100 | #159 | Good 92.7% |
| Immigrants | Lebanon | 70.7 /100 | #160 | Good 92.7% |
| Immigrants | Argentina | 69.8 /100 | #161 | Good 92.7% |
| Paraguayans | 68.7 /100 | #162 | Good 92.7% |
| Immigrants | Nonimmigrants | 66.6 /100 | #163 | Good 92.7% |
| Spanish | 66.2 /100 | #164 | Good 92.7% |
| Immigrants | Iraq | 63.7 /100 | #165 | Good 92.6% |
| Bermudans | 62.3 /100 | #166 | Good 92.6% |
Demographics Similar to Koreans by 11th Grade
In terms of 11th grade, the demographic groups most similar to Koreans are Immigrants from Ethiopia (92.1%, a difference of 0.010%), Afghan (92.1%, a difference of 0.030%), Immigrants from Southern Europe (92.1%, a difference of 0.040%), Immigrants from Micronesia (92.2%, a difference of 0.060%), and Somali (92.1%, a difference of 0.060%).
| Demographics | Rating | Rank | 11th Grade |
| Kiowa | 23.2 /100 | #205 | Fair 92.2% |
| Bolivians | 23.2 /100 | #206 | Fair 92.2% |
| Immigrants | Oceania | 22.4 /100 | #207 | Fair 92.2% |
| Colville | 21.8 /100 | #208 | Fair 92.2% |
| Tongans | 19.8 /100 | #209 | Poor 92.2% |
| Ethiopians | 18.8 /100 | #210 | Poor 92.2% |
| Immigrants | Micronesia | 17.7 /100 | #211 | Poor 92.2% |
| Koreans | 14.4 /100 | #212 | Poor 92.1% |
| Immigrants | Ethiopia | 13.9 /100 | #213 | Poor 92.1% |
| Afghans | 12.8 /100 | #214 | Poor 92.1% |
| Immigrants | Southern Europe | 12.5 /100 | #215 | Poor 92.1% |
| Somalis | 11.6 /100 | #216 | Poor 92.1% |
| Immigrants | Sierra Leone | 11.1 /100 | #217 | Poor 92.0% |
| Blackfeet | 10.1 /100 | #218 | Poor 92.0% |
| Portuguese | 10.0 /100 | #219 | Tragic 92.0% |