Immigrants from Bangladesh vs Immigrants from Grenada 4th Grade
COMPARE
Immigrants from Bangladesh
Immigrants from Grenada
4th Grade
4th Grade Comparison
Immigrants from Bangladesh
Immigrants from Grenada
96.2%
4TH GRADE
0.0/ 100
METRIC RATING
311th/ 347
METRIC RANK
96.7%
4TH GRADE
0.0/ 100
METRIC RATING
291st/ 347
METRIC RANK
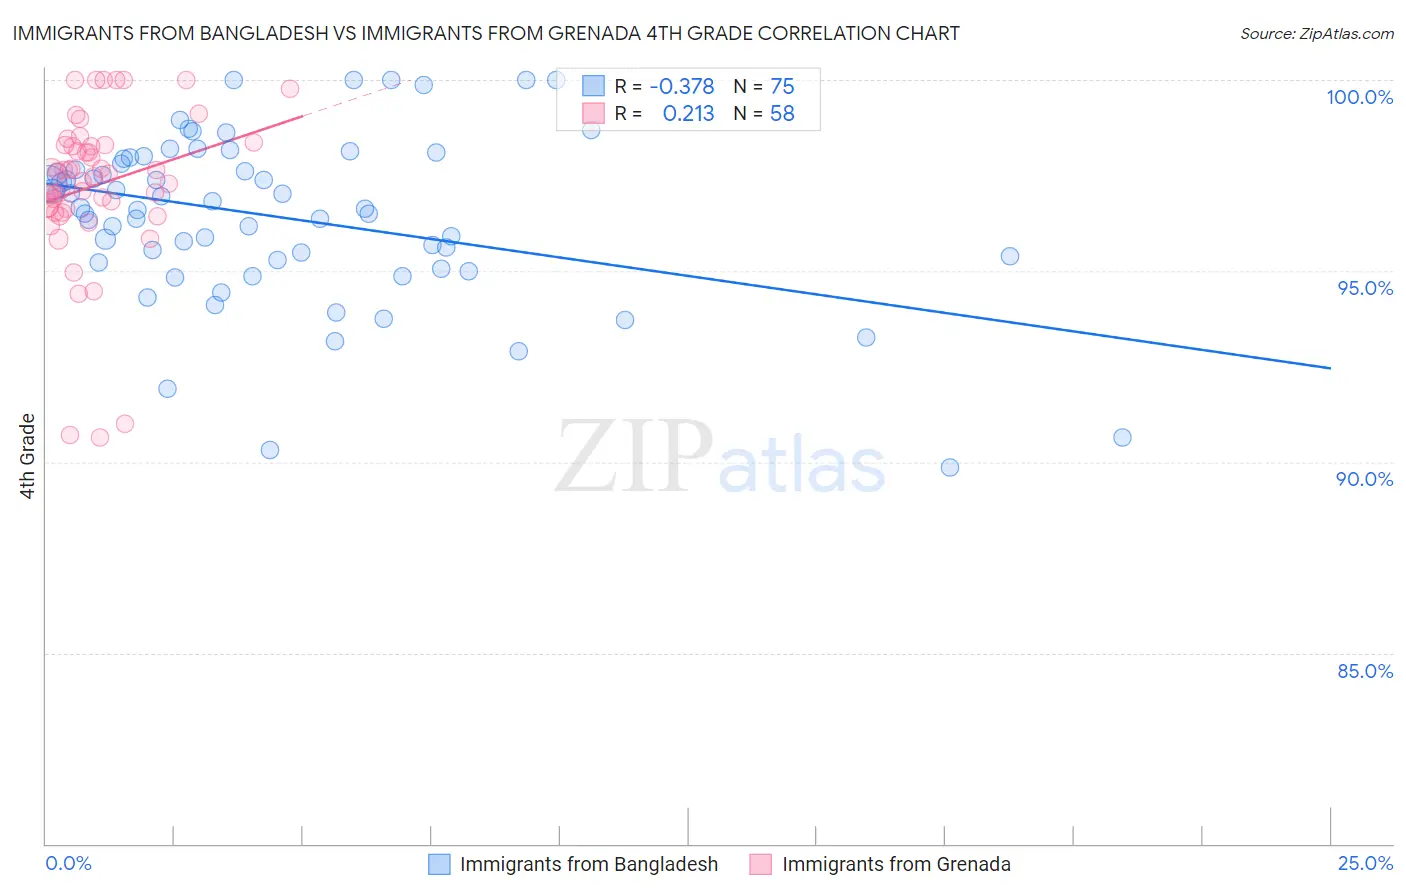
Immigrants from Bangladesh vs Immigrants from Grenada 4th Grade Correlation Chart
The statistical analysis conducted on geographies consisting of 203,671,281 people shows a mild negative correlation between the proportion of Immigrants from Bangladesh and percentage of population with at least 4th grade education in the United States with a correlation coefficient (R) of -0.378 and weighted average of 96.2%. Similarly, the statistical analysis conducted on geographies consisting of 67,199,790 people shows a weak positive correlation between the proportion of Immigrants from Grenada and percentage of population with at least 4th grade education in the United States with a correlation coefficient (R) of 0.213 and weighted average of 96.7%, a difference of 0.48%.
4th Grade Correlation Summary
| Measurement | Immigrants from Bangladesh | Immigrants from Grenada |
| Minimum | 89.8% | 90.6% |
| Maximum | 100.0% | 100.0% |
| Range | 10.2% | 9.4% |
| Mean | 96.4% | 97.2% |
| Median | 96.6% | 97.5% |
| Interquartile 25% (IQ1) | 95.2% | 96.6% |
| Interquartile 75% (IQ3) | 97.9% | 98.3% |
| Interquartile Range (IQR) | 2.7% | 1.7% |
| Standard Deviation (Sample) | 2.2% | 2.0% |
| Standard Deviation (Population) | 2.2% | 2.0% |
Demographics Similar to Immigrants from Bangladesh and Immigrants from Grenada by 4th Grade
In terms of 4th grade, the demographic groups most similar to Immigrants from Bangladesh are Immigrants from Burma/Myanmar (96.3%, a difference of 0.050%), Immigrants from Laos (96.3%, a difference of 0.070%), Immigrants from Guyana (96.3%, a difference of 0.070%), Immigrants from Haiti (96.3%, a difference of 0.080%), and Sri Lankan (96.4%, a difference of 0.11%). Similarly, the demographic groups most similar to Immigrants from Grenada are Malaysian (96.7%, a difference of 0.010%), Puerto Rican (96.7%, a difference of 0.030%), Immigrants from Eritrea (96.7%, a difference of 0.050%), Immigrants from Portugal (96.6%, a difference of 0.070%), and Somali (96.6%, a difference of 0.080%).
| Demographics | Rating | Rank | 4th Grade |
| Immigrants | Grenada | 0.0 /100 | #291 | Tragic 96.7% |
| Malaysians | 0.0 /100 | #292 | Tragic 96.7% |
| Puerto Ricans | 0.0 /100 | #293 | Tragic 96.7% |
| Immigrants | Eritrea | 0.0 /100 | #294 | Tragic 96.7% |
| Immigrants | Portugal | 0.0 /100 | #295 | Tragic 96.6% |
| Somalis | 0.0 /100 | #296 | Tragic 96.6% |
| Immigrants | Somalia | 0.0 /100 | #297 | Tragic 96.5% |
| Haitians | 0.0 /100 | #298 | Tragic 96.5% |
| Immigrants | Dominica | 0.0 /100 | #299 | Tragic 96.5% |
| Immigrants | South Eastern Asia | 0.0 /100 | #300 | Tragic 96.5% |
| Immigrants | Immigrants | 0.0 /100 | #301 | Tragic 96.5% |
| Immigrants | Cuba | 0.0 /100 | #302 | Tragic 96.4% |
| Guyanese | 0.0 /100 | #303 | Tragic 96.4% |
| Ecuadorians | 0.0 /100 | #304 | Tragic 96.4% |
| Immigrants | Caribbean | 0.0 /100 | #305 | Tragic 96.4% |
| Sri Lankans | 0.0 /100 | #306 | Tragic 96.4% |
| Immigrants | Haiti | 0.0 /100 | #307 | Tragic 96.3% |
| Immigrants | Laos | 0.0 /100 | #308 | Tragic 96.3% |
| Immigrants | Guyana | 0.0 /100 | #309 | Tragic 96.3% |
| Immigrants | Burma/Myanmar | 0.0 /100 | #310 | Tragic 96.3% |
| Immigrants | Bangladesh | 0.0 /100 | #311 | Tragic 96.2% |