Immigrants from Bangladesh vs Brazilian 12th Grade, No Diploma
COMPARE
Immigrants from Bangladesh
Brazilian
12th Grade, No Diploma
12th Grade, No Diploma Comparison
Immigrants from Bangladesh
Brazilians
88.0%
12TH GRADE, NO DIPLOMA
0.0/ 100
METRIC RATING
303rd/ 347
METRIC RANK
91.3%
12TH GRADE, NO DIPLOMA
62.0/ 100
METRIC RATING
162nd/ 347
METRIC RANK
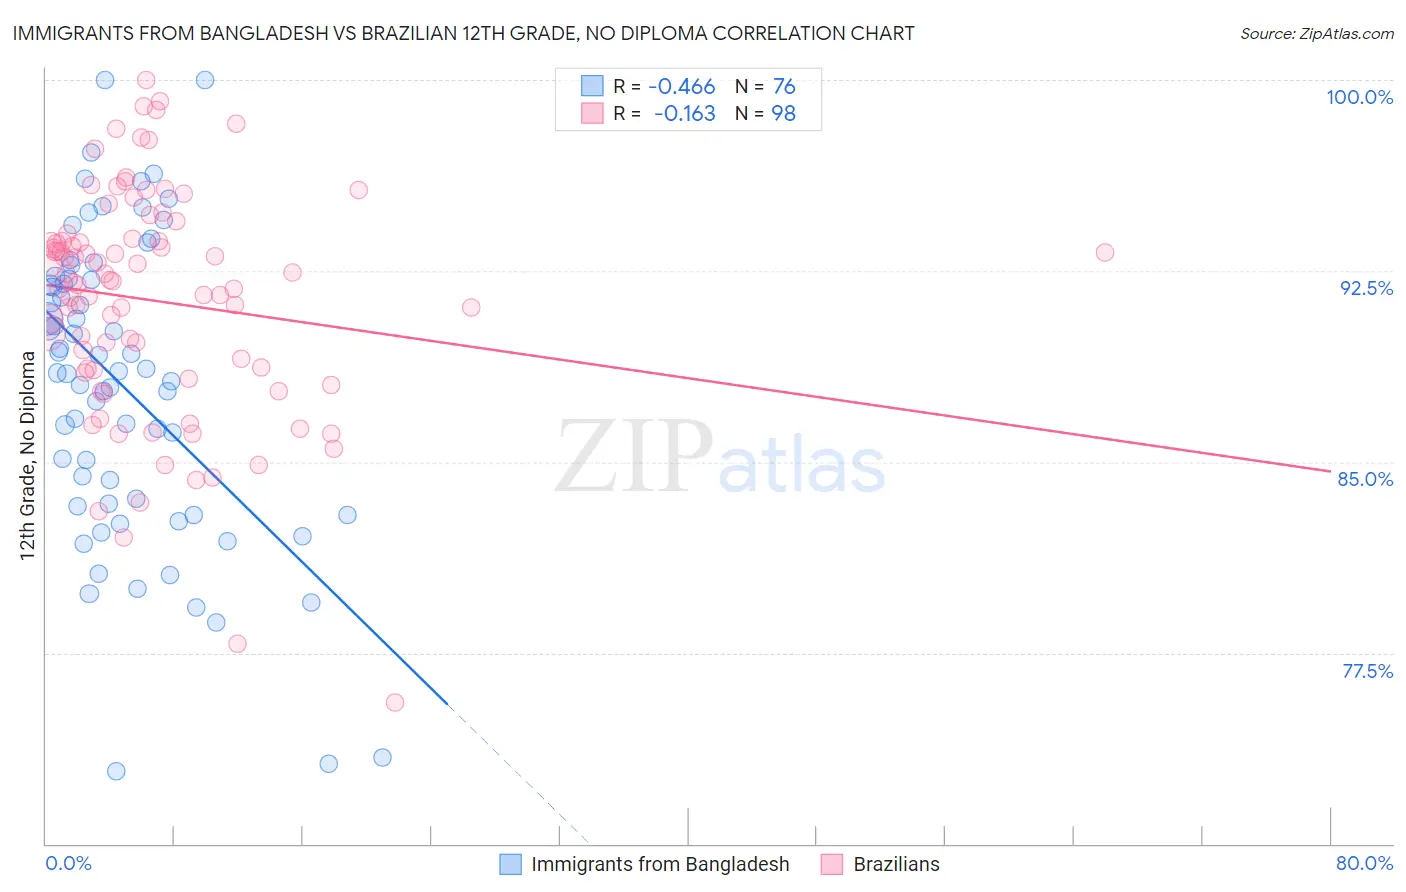
Immigrants from Bangladesh vs Brazilian 12th Grade, No Diploma Correlation Chart
The statistical analysis conducted on geographies consisting of 203,672,706 people shows a moderate negative correlation between the proportion of Immigrants from Bangladesh and percentage of population with at least 12th grade (no diploma) education in the United States with a correlation coefficient (R) of -0.466 and weighted average of 88.0%. Similarly, the statistical analysis conducted on geographies consisting of 323,949,472 people shows a poor negative correlation between the proportion of Brazilians and percentage of population with at least 12th grade (no diploma) education in the United States with a correlation coefficient (R) of -0.163 and weighted average of 91.3%, a difference of 3.8%.
12th Grade, No Diploma Correlation Summary
| Measurement | Immigrants from Bangladesh | Brazilian |
| Minimum | 72.9% | 75.6% |
| Maximum | 100.0% | 100.0% |
| Range | 27.1% | 24.4% |
| Mean | 88.0% | 91.3% |
| Median | 88.5% | 92.1% |
| Interquartile 25% (IQ1) | 83.3% | 88.6% |
| Interquartile 75% (IQ3) | 92.2% | 93.6% |
| Interquartile Range (IQR) | 8.9% | 5.0% |
| Standard Deviation (Sample) | 6.0% | 4.5% |
| Standard Deviation (Population) | 5.9% | 4.5% |
Similar Demographics by 12th Grade, No Diploma
Demographics Similar to Immigrants from Bangladesh by 12th Grade, No Diploma
In terms of 12th grade, no diploma, the demographic groups most similar to Immigrants from Bangladesh are Vietnamese (87.9%, a difference of 0.060%), Ecuadorian (88.0%, a difference of 0.10%), Immigrants from Guyana (88.1%, a difference of 0.13%), Immigrants from Cambodia (88.1%, a difference of 0.13%), and Nepalese (88.1%, a difference of 0.18%).
| Demographics | Rating | Rank | 12th Grade, No Diploma |
| Fijians | 0.0 /100 | #296 | Tragic 88.2% |
| Pueblo | 0.0 /100 | #297 | Tragic 88.2% |
| Immigrants | Haiti | 0.0 /100 | #298 | Tragic 88.2% |
| Nepalese | 0.0 /100 | #299 | Tragic 88.1% |
| Immigrants | Guyana | 0.0 /100 | #300 | Tragic 88.1% |
| Immigrants | Cambodia | 0.0 /100 | #301 | Tragic 88.1% |
| Ecuadorians | 0.0 /100 | #302 | Tragic 88.0% |
| Immigrants | Bangladesh | 0.0 /100 | #303 | Tragic 88.0% |
| Vietnamese | 0.0 /100 | #304 | Tragic 87.9% |
| Immigrants | Dominica | 0.0 /100 | #305 | Tragic 87.7% |
| Natives/Alaskans | 0.0 /100 | #306 | Tragic 87.7% |
| Immigrants | Portugal | 0.0 /100 | #307 | Tragic 87.6% |
| Yup'ik | 0.0 /100 | #308 | Tragic 87.6% |
| Immigrants | Armenia | 0.0 /100 | #309 | Tragic 87.6% |
| Immigrants | Cuba | 0.0 /100 | #310 | Tragic 87.5% |
Demographics Similar to Brazilians by 12th Grade, No Diploma
In terms of 12th grade, no diploma, the demographic groups most similar to Brazilians are Immigrants from Asia (91.3%, a difference of 0.010%), Immigrants from China (91.3%, a difference of 0.010%), Immigrants from Hong Kong (91.3%, a difference of 0.020%), Laotian (91.3%, a difference of 0.030%), and Immigrants from Albania (91.3%, a difference of 0.030%).
| Demographics | Rating | Rank | 12th Grade, No Diploma |
| Immigrants | Iraq | 73.0 /100 | #155 | Good 91.4% |
| Asians | 71.9 /100 | #156 | Good 91.4% |
| Immigrants | Pakistan | 70.7 /100 | #157 | Good 91.4% |
| Immigrants | Northern Africa | 66.2 /100 | #158 | Good 91.4% |
| Laotians | 64.4 /100 | #159 | Good 91.3% |
| Immigrants | Albania | 64.1 /100 | #160 | Good 91.3% |
| Immigrants | Hong Kong | 63.8 /100 | #161 | Good 91.3% |
| Brazilians | 62.0 /100 | #162 | Good 91.3% |
| Immigrants | Asia | 61.5 /100 | #163 | Good 91.3% |
| Immigrants | China | 60.9 /100 | #164 | Good 91.3% |
| Alsatians | 58.3 /100 | #165 | Average 91.3% |
| Hmong | 58.0 /100 | #166 | Average 91.3% |
| Immigrants | Malaysia | 57.8 /100 | #167 | Average 91.3% |
| Cree | 57.0 /100 | #168 | Average 91.2% |
| Immigrants | Indonesia | 54.9 /100 | #169 | Average 91.2% |