Immigrants from Bangladesh vs Immigrants from Eritrea 12th Grade, No Diploma
COMPARE
Immigrants from Bangladesh
Immigrants from Eritrea
12th Grade, No Diploma
12th Grade, No Diploma Comparison
Immigrants from Bangladesh
Immigrants from Eritrea
88.0%
12TH GRADE, NO DIPLOMA
0.0/ 100
METRIC RATING
303rd/ 347
METRIC RANK
89.9%
12TH GRADE, NO DIPLOMA
1.0/ 100
METRIC RATING
250th/ 347
METRIC RANK
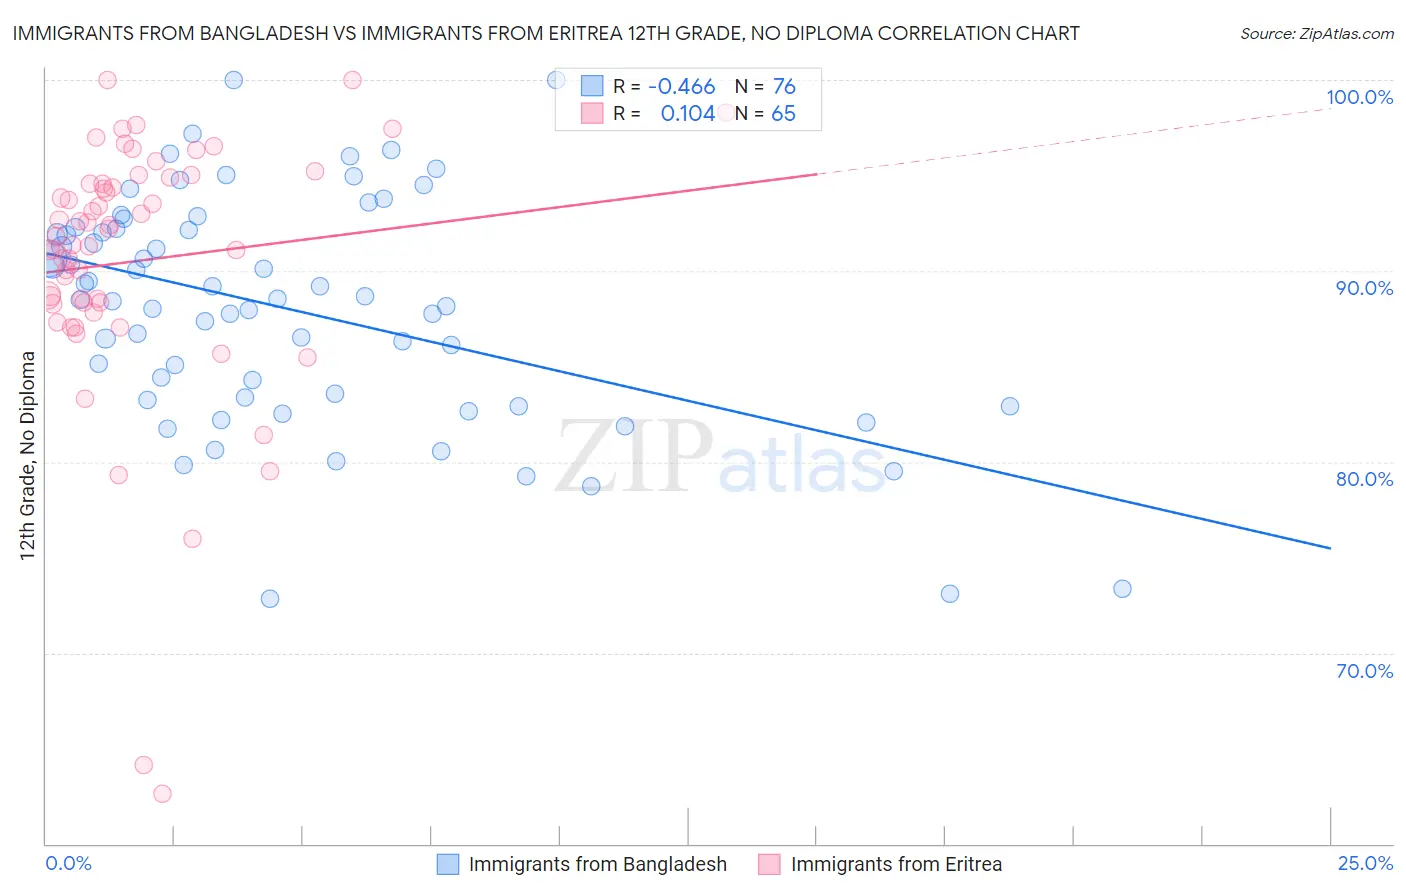
Immigrants from Bangladesh vs Immigrants from Eritrea 12th Grade, No Diploma Correlation Chart
The statistical analysis conducted on geographies consisting of 203,672,706 people shows a moderate negative correlation between the proportion of Immigrants from Bangladesh and percentage of population with at least 12th grade (no diploma) education in the United States with a correlation coefficient (R) of -0.466 and weighted average of 88.0%. Similarly, the statistical analysis conducted on geographies consisting of 104,792,854 people shows a poor positive correlation between the proportion of Immigrants from Eritrea and percentage of population with at least 12th grade (no diploma) education in the United States with a correlation coefficient (R) of 0.104 and weighted average of 89.9%, a difference of 2.2%.
12th Grade, No Diploma Correlation Summary
| Measurement | Immigrants from Bangladesh | Immigrants from Eritrea |
| Minimum | 72.9% | 62.6% |
| Maximum | 100.0% | 100.0% |
| Range | 27.1% | 37.4% |
| Mean | 88.0% | 90.5% |
| Median | 88.5% | 91.8% |
| Interquartile 25% (IQ1) | 83.3% | 88.3% |
| Interquartile 75% (IQ3) | 92.2% | 94.7% |
| Interquartile Range (IQR) | 8.9% | 6.4% |
| Standard Deviation (Sample) | 6.0% | 6.9% |
| Standard Deviation (Population) | 5.9% | 6.8% |
Similar Demographics by 12th Grade, No Diploma
Demographics Similar to Immigrants from Bangladesh by 12th Grade, No Diploma
In terms of 12th grade, no diploma, the demographic groups most similar to Immigrants from Bangladesh are Vietnamese (87.9%, a difference of 0.060%), Ecuadorian (88.0%, a difference of 0.10%), Immigrants from Guyana (88.1%, a difference of 0.13%), Immigrants from Cambodia (88.1%, a difference of 0.13%), and Nepalese (88.1%, a difference of 0.18%).
| Demographics | Rating | Rank | 12th Grade, No Diploma |
| Fijians | 0.0 /100 | #296 | Tragic 88.2% |
| Pueblo | 0.0 /100 | #297 | Tragic 88.2% |
| Immigrants | Haiti | 0.0 /100 | #298 | Tragic 88.2% |
| Nepalese | 0.0 /100 | #299 | Tragic 88.1% |
| Immigrants | Guyana | 0.0 /100 | #300 | Tragic 88.1% |
| Immigrants | Cambodia | 0.0 /100 | #301 | Tragic 88.1% |
| Ecuadorians | 0.0 /100 | #302 | Tragic 88.0% |
| Immigrants | Bangladesh | 0.0 /100 | #303 | Tragic 88.0% |
| Vietnamese | 0.0 /100 | #304 | Tragic 87.9% |
| Immigrants | Dominica | 0.0 /100 | #305 | Tragic 87.7% |
| Natives/Alaskans | 0.0 /100 | #306 | Tragic 87.7% |
| Immigrants | Portugal | 0.0 /100 | #307 | Tragic 87.6% |
| Yup'ik | 0.0 /100 | #308 | Tragic 87.6% |
| Immigrants | Armenia | 0.0 /100 | #309 | Tragic 87.6% |
| Immigrants | Cuba | 0.0 /100 | #310 | Tragic 87.5% |
Demographics Similar to Immigrants from Eritrea by 12th Grade, No Diploma
In terms of 12th grade, no diploma, the demographic groups most similar to Immigrants from Eritrea are Spanish American (89.9%, a difference of 0.010%), Bahamian (89.9%, a difference of 0.010%), Comanche (89.9%, a difference of 0.030%), Senegalese (89.9%, a difference of 0.030%), and Immigrants from Nigeria (89.9%, a difference of 0.090%).
| Demographics | Rating | Rank | 12th Grade, No Diploma |
| Crow | 1.5 /100 | #243 | Tragic 90.0% |
| Taiwanese | 1.5 /100 | #244 | Tragic 90.0% |
| Immigrants | Uruguay | 1.4 /100 | #245 | Tragic 90.0% |
| Ghanaians | 1.3 /100 | #246 | Tragic 90.0% |
| Immigrants | Nigeria | 1.3 /100 | #247 | Tragic 89.9% |
| Comanche | 1.1 /100 | #248 | Tragic 89.9% |
| Senegalese | 1.1 /100 | #249 | Tragic 89.9% |
| Immigrants | Eritrea | 1.0 /100 | #250 | Tragic 89.9% |
| Spanish Americans | 0.9 /100 | #251 | Tragic 89.9% |
| Bahamians | 0.9 /100 | #252 | Tragic 89.9% |
| Choctaw | 0.7 /100 | #253 | Tragic 89.8% |
| Immigrants | Peru | 0.5 /100 | #254 | Tragic 89.7% |
| Immigrants | Senegal | 0.5 /100 | #255 | Tragic 89.7% |
| Immigrants | Ghana | 0.5 /100 | #256 | Tragic 89.7% |
| Jamaicans | 0.5 /100 | #257 | Tragic 89.7% |