Immigrants from Bangladesh vs Ecuadorian 10th Grade
COMPARE
Immigrants from Bangladesh
Ecuadorian
10th Grade
10th Grade Comparison
Immigrants from Bangladesh
Ecuadorians
91.0%
10TH GRADE
0.0/ 100
METRIC RATING
308th/ 347
METRIC RANK
90.6%
10TH GRADE
0.0/ 100
METRIC RATING
316th/ 347
METRIC RANK
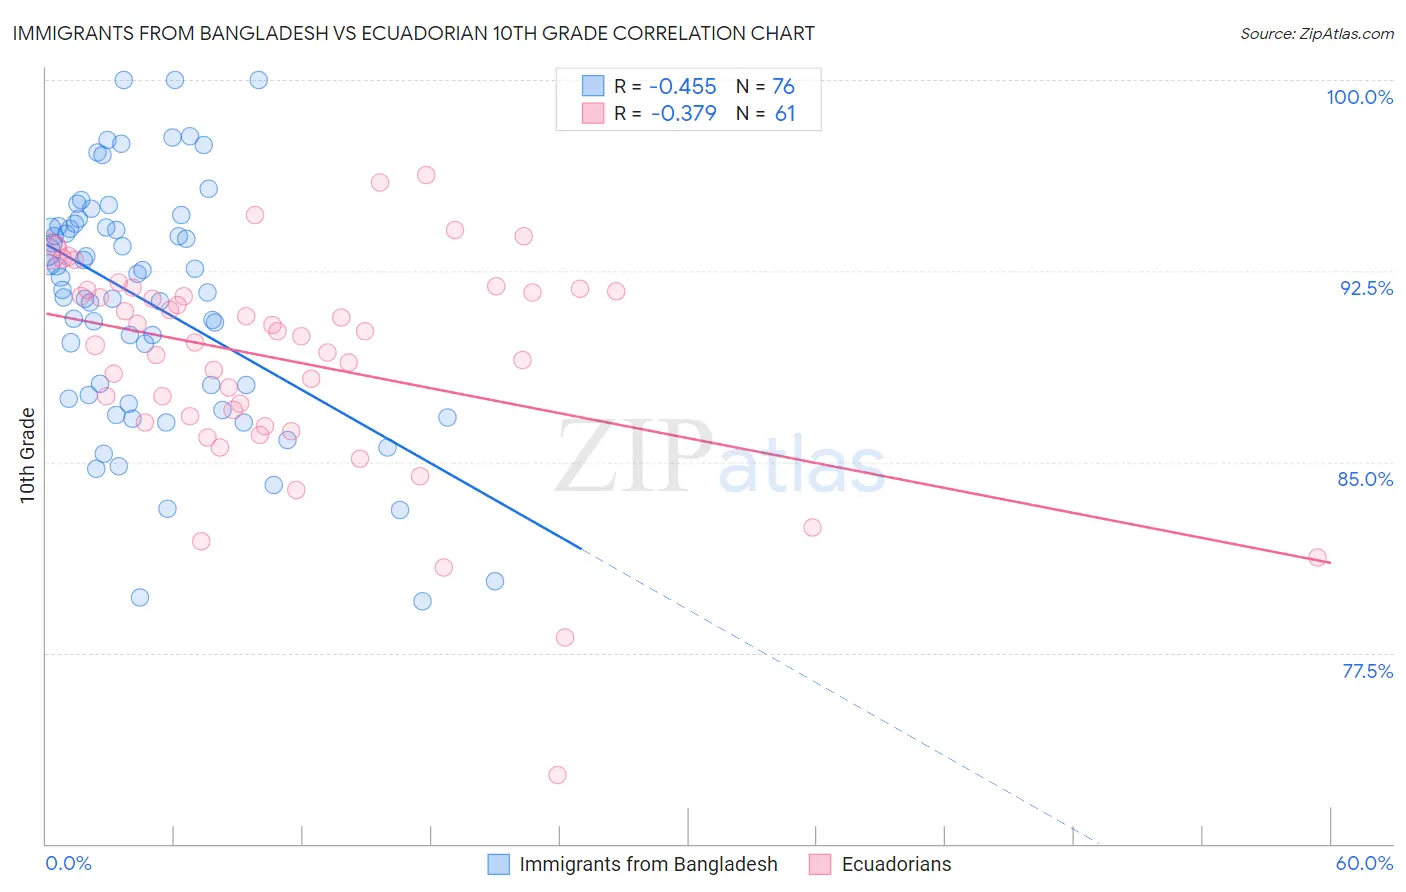
Immigrants from Bangladesh vs Ecuadorian 10th Grade Correlation Chart
The statistical analysis conducted on geographies consisting of 203,672,706 people shows a moderate negative correlation between the proportion of Immigrants from Bangladesh and percentage of population with at least 10th grade education in the United States with a correlation coefficient (R) of -0.455 and weighted average of 91.0%. Similarly, the statistical analysis conducted on geographies consisting of 317,864,750 people shows a mild negative correlation between the proportion of Ecuadorians and percentage of population with at least 10th grade education in the United States with a correlation coefficient (R) of -0.379 and weighted average of 90.6%, a difference of 0.46%.
10th Grade Correlation Summary
| Measurement | Immigrants from Bangladesh | Ecuadorian |
| Minimum | 79.5% | 72.7% |
| Maximum | 100.0% | 96.2% |
| Range | 20.5% | 23.5% |
| Mean | 91.2% | 89.0% |
| Median | 92.0% | 89.9% |
| Interquartile 25% (IQ1) | 87.6% | 86.7% |
| Interquartile 75% (IQ3) | 94.2% | 91.7% |
| Interquartile Range (IQR) | 6.7% | 5.1% |
| Standard Deviation (Sample) | 4.7% | 4.3% |
| Standard Deviation (Population) | 4.7% | 4.3% |
Demographics Similar to Immigrants from Bangladesh and Ecuadorians by 10th Grade
In terms of 10th grade, the demographic groups most similar to Immigrants from Bangladesh are Immigrants from Fiji (91.0%, a difference of 0.010%), Immigrants (91.0%, a difference of 0.040%), Yaqui (91.1%, a difference of 0.070%), Vietnamese (90.9%, a difference of 0.080%), and Immigrants from Cambodia (90.9%, a difference of 0.10%). Similarly, the demographic groups most similar to Ecuadorians are Immigrants from Caribbean (90.6%, a difference of 0.010%), Nepalese (90.7%, a difference of 0.090%), Cape Verdean (90.8%, a difference of 0.17%), Immigrants from Ecuador (90.4%, a difference of 0.17%), and Immigrants from Portugal (90.8%, a difference of 0.20%).
| Demographics | Rating | Rank | 10th Grade |
| Immigrants | Guyana | 0.0 /100 | #302 | Tragic 91.2% |
| Immigrants | Vietnam | 0.0 /100 | #303 | Tragic 91.2% |
| Pima | 0.0 /100 | #304 | Tragic 91.2% |
| Immigrants | Dominica | 0.0 /100 | #305 | Tragic 91.1% |
| Yaqui | 0.0 /100 | #306 | Tragic 91.1% |
| Immigrants | Fiji | 0.0 /100 | #307 | Tragic 91.0% |
| Immigrants | Bangladesh | 0.0 /100 | #308 | Tragic 91.0% |
| Immigrants | Immigrants | 0.0 /100 | #309 | Tragic 91.0% |
| Vietnamese | 0.0 /100 | #310 | Tragic 90.9% |
| Immigrants | Cambodia | 0.0 /100 | #311 | Tragic 90.9% |
| Immigrants | Portugal | 0.0 /100 | #312 | Tragic 90.8% |
| Cape Verdeans | 0.0 /100 | #313 | Tragic 90.8% |
| Nepalese | 0.0 /100 | #314 | Tragic 90.7% |
| Immigrants | Caribbean | 0.0 /100 | #315 | Tragic 90.6% |
| Ecuadorians | 0.0 /100 | #316 | Tragic 90.6% |
| Immigrants | Ecuador | 0.0 /100 | #317 | Tragic 90.4% |
| Immigrants | Cuba | 0.0 /100 | #318 | Tragic 90.2% |
| Nicaraguans | 0.0 /100 | #319 | Tragic 90.2% |
| Houma | 0.0 /100 | #320 | Tragic 90.2% |
| Belizeans | 0.0 /100 | #321 | Tragic 90.2% |
| Tohono O'odham | 0.0 /100 | #322 | Tragic 90.1% |