Honduran vs Palestinian 12th Grade, No Diploma
COMPARE
Honduran
Palestinian
12th Grade, No Diploma
12th Grade, No Diploma Comparison
Hondurans
Palestinians
85.5%
12TH GRADE, NO DIPLOMA
0.0/ 100
METRIC RATING
328th/ 347
METRIC RANK
92.1%
12TH GRADE, NO DIPLOMA
97.0/ 100
METRIC RATING
110th/ 347
METRIC RANK
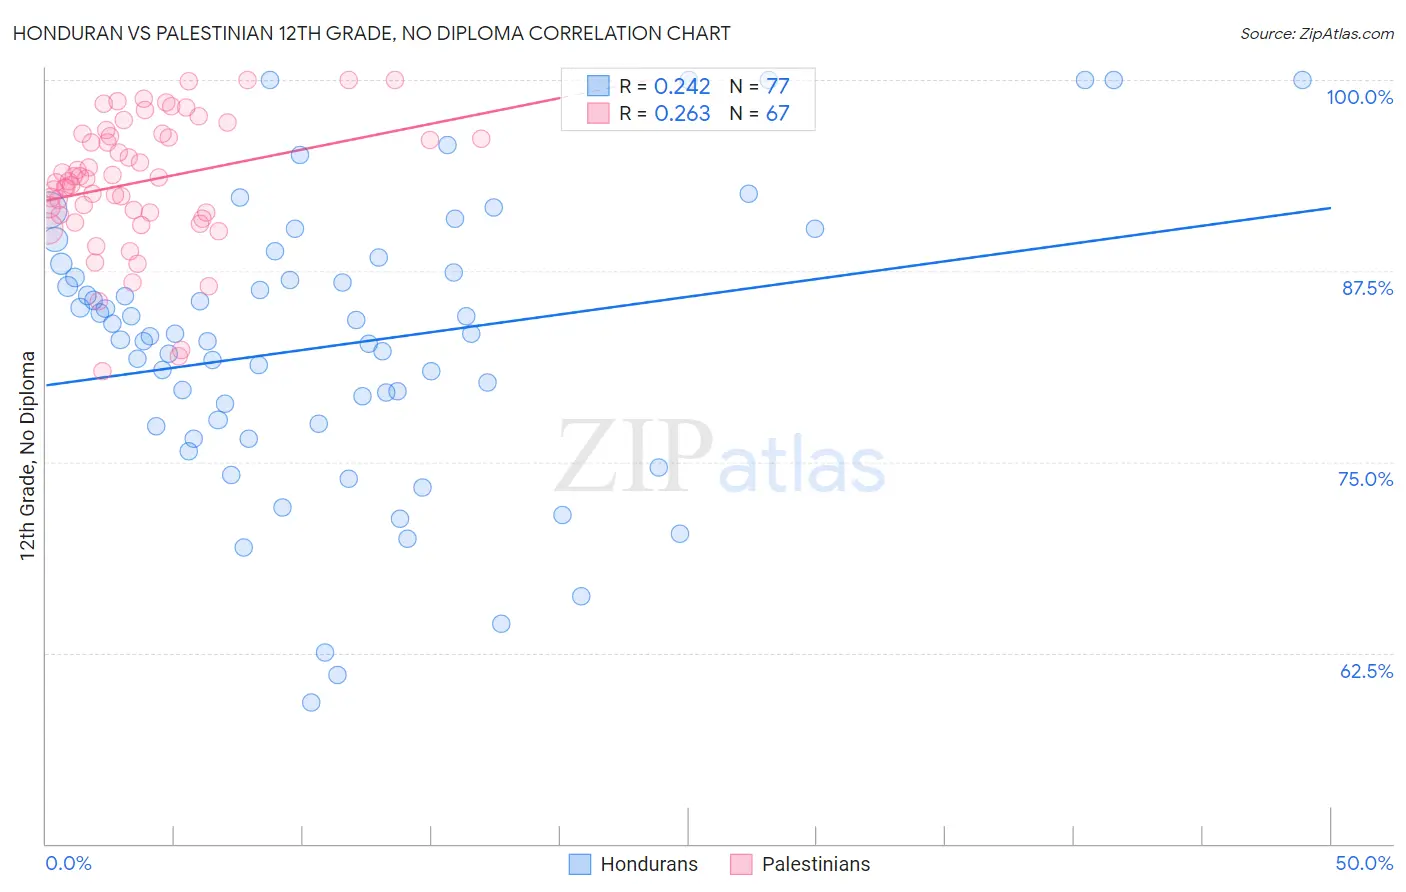
Honduran vs Palestinian 12th Grade, No Diploma Correlation Chart
The statistical analysis conducted on geographies consisting of 357,858,827 people shows a weak positive correlation between the proportion of Hondurans and percentage of population with at least 12th grade (no diploma) education in the United States with a correlation coefficient (R) of 0.242 and weighted average of 85.5%. Similarly, the statistical analysis conducted on geographies consisting of 216,461,770 people shows a weak positive correlation between the proportion of Palestinians and percentage of population with at least 12th grade (no diploma) education in the United States with a correlation coefficient (R) of 0.263 and weighted average of 92.1%, a difference of 7.7%.
12th Grade, No Diploma Correlation Summary
| Measurement | Honduran | Palestinian |
| Minimum | 59.2% | 80.9% |
| Maximum | 100.0% | 100.0% |
| Range | 40.8% | 19.1% |
| Mean | 82.7% | 93.3% |
| Median | 83.3% | 93.5% |
| Interquartile 25% (IQ1) | 77.4% | 91.2% |
| Interquartile 75% (IQ3) | 87.7% | 96.5% |
| Interquartile Range (IQR) | 10.3% | 5.3% |
| Standard Deviation (Sample) | 9.2% | 4.3% |
| Standard Deviation (Population) | 9.1% | 4.3% |
Similar Demographics by 12th Grade, No Diploma
Demographics Similar to Hondurans by 12th Grade, No Diploma
In terms of 12th grade, no diploma, the demographic groups most similar to Hondurans are Hispanic or Latino (85.4%, a difference of 0.090%), Lumbee (85.7%, a difference of 0.19%), Dominican (85.7%, a difference of 0.20%), Mexican American Indian (85.7%, a difference of 0.22%), and Immigrants from the Azores (85.3%, a difference of 0.23%).
| Demographics | Rating | Rank | 12th Grade, No Diploma |
| Puerto Ricans | 0.0 /100 | #321 | Tragic 86.5% |
| Central American Indians | 0.0 /100 | #322 | Tragic 86.5% |
| Yuman | 0.0 /100 | #323 | Tragic 86.5% |
| Immigrants | Cabo Verde | 0.0 /100 | #324 | Tragic 85.8% |
| Mexican American Indians | 0.0 /100 | #325 | Tragic 85.7% |
| Dominicans | 0.0 /100 | #326 | Tragic 85.7% |
| Lumbee | 0.0 /100 | #327 | Tragic 85.7% |
| Hondurans | 0.0 /100 | #328 | Tragic 85.5% |
| Hispanics or Latinos | 0.0 /100 | #329 | Tragic 85.4% |
| Immigrants | Azores | 0.0 /100 | #330 | Tragic 85.3% |
| Central Americans | 0.0 /100 | #331 | Tragic 85.2% |
| Immigrants | Honduras | 0.0 /100 | #332 | Tragic 85.0% |
| Immigrants | Latin America | 0.0 /100 | #333 | Tragic 85.0% |
| Immigrants | Dominican Republic | 0.0 /100 | #334 | Tragic 84.9% |
| Immigrants | Yemen | 0.0 /100 | #335 | Tragic 84.8% |
Demographics Similar to Palestinians by 12th Grade, No Diploma
In terms of 12th grade, no diploma, the demographic groups most similar to Palestinians are Immigrants from Hungary (92.1%, a difference of 0.0%), Immigrants from Greece (92.1%, a difference of 0.010%), Jordanian (92.2%, a difference of 0.020%), Israeli (92.1%, a difference of 0.020%), and Syrian (92.2%, a difference of 0.030%).
| Demographics | Rating | Rank | 12th Grade, No Diploma |
| Immigrants | Norway | 98.1 /100 | #103 | Exceptional 92.3% |
| Lebanese | 97.6 /100 | #104 | Exceptional 92.2% |
| Immigrants | Belarus | 97.4 /100 | #105 | Exceptional 92.2% |
| Immigrants | Russia | 97.3 /100 | #106 | Exceptional 92.2% |
| Syrians | 97.2 /100 | #107 | Exceptional 92.2% |
| Jordanians | 97.2 /100 | #108 | Exceptional 92.2% |
| Immigrants | Hungary | 97.0 /100 | #109 | Exceptional 92.1% |
| Palestinians | 97.0 /100 | #110 | Exceptional 92.1% |
| Immigrants | Greece | 96.9 /100 | #111 | Exceptional 92.1% |
| Israelis | 96.8 /100 | #112 | Exceptional 92.1% |
| Immigrants | Zimbabwe | 96.5 /100 | #113 | Exceptional 92.1% |
| Yugoslavians | 96.5 /100 | #114 | Exceptional 92.1% |
| Immigrants | Sri Lanka | 96.4 /100 | #115 | Exceptional 92.1% |
| Aleuts | 96.3 /100 | #116 | Exceptional 92.1% |
| Immigrants | Eastern Europe | 96.3 /100 | #117 | Exceptional 92.1% |