South African vs Palestinian 12th Grade, No Diploma
COMPARE
South African
Palestinian
12th Grade, No Diploma
12th Grade, No Diploma Comparison
South Africans
Palestinians
92.4%
12TH GRADE, NO DIPLOMA
98.6/ 100
METRIC RATING
91st/ 347
METRIC RANK
92.1%
12TH GRADE, NO DIPLOMA
97.0/ 100
METRIC RATING
110th/ 347
METRIC RANK
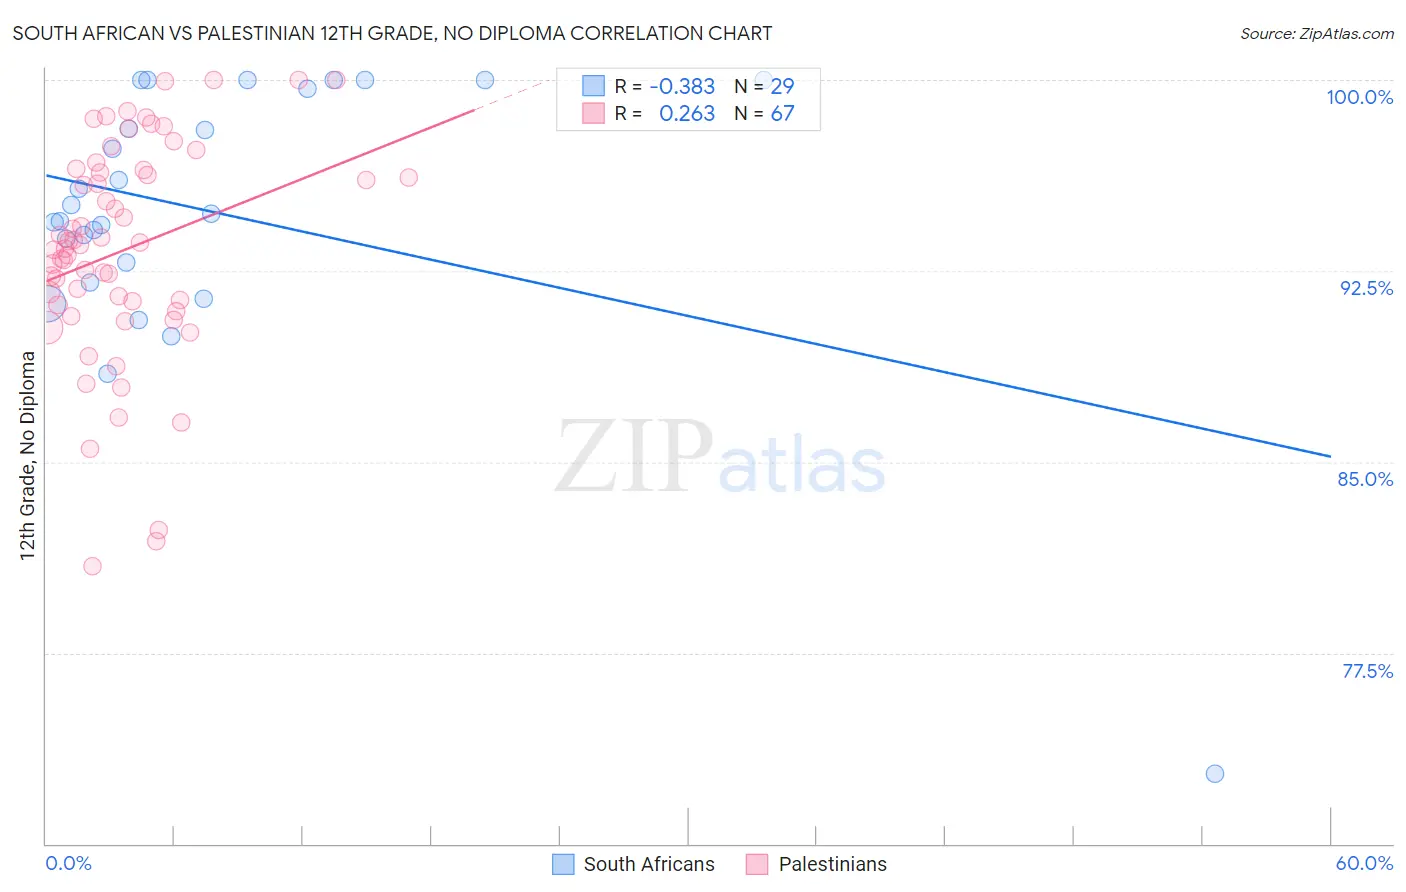
South African vs Palestinian 12th Grade, No Diploma Correlation Chart
The statistical analysis conducted on geographies consisting of 182,604,532 people shows a mild negative correlation between the proportion of South Africans and percentage of population with at least 12th grade (no diploma) education in the United States with a correlation coefficient (R) of -0.383 and weighted average of 92.4%. Similarly, the statistical analysis conducted on geographies consisting of 216,461,770 people shows a weak positive correlation between the proportion of Palestinians and percentage of population with at least 12th grade (no diploma) education in the United States with a correlation coefficient (R) of 0.263 and weighted average of 92.1%, a difference of 0.23%.
12th Grade, No Diploma Correlation Summary
| Measurement | South African | Palestinian |
| Minimum | 72.7% | 80.9% |
| Maximum | 100.0% | 100.0% |
| Range | 27.3% | 19.1% |
| Mean | 94.8% | 93.3% |
| Median | 94.7% | 93.5% |
| Interquartile 25% (IQ1) | 92.4% | 91.2% |
| Interquartile 75% (IQ3) | 99.8% | 96.5% |
| Interquartile Range (IQR) | 7.4% | 5.3% |
| Standard Deviation (Sample) | 5.5% | 4.3% |
| Standard Deviation (Population) | 5.4% | 4.3% |
Demographics Similar to South Africans and Palestinians by 12th Grade, No Diploma
In terms of 12th grade, no diploma, the demographic groups most similar to South Africans are Immigrants from Serbia (92.4%, a difference of 0.010%), Immigrants from Romania (92.3%, a difference of 0.010%), Immigrants from Western Europe (92.3%, a difference of 0.010%), Immigrants from Europe (92.3%, a difference of 0.020%), and Immigrants from North Macedonia (92.3%, a difference of 0.030%). Similarly, the demographic groups most similar to Palestinians are Immigrants from Hungary (92.1%, a difference of 0.0%), Jordanian (92.2%, a difference of 0.020%), Syrian (92.2%, a difference of 0.030%), Immigrants from Russia (92.2%, a difference of 0.040%), and Immigrants from Belarus (92.2%, a difference of 0.050%).
| Demographics | Rating | Rank | 12th Grade, No Diploma |
| Immigrants | Serbia | 98.6 /100 | #90 | Exceptional 92.4% |
| South Africans | 98.6 /100 | #91 | Exceptional 92.4% |
| Immigrants | Romania | 98.5 /100 | #92 | Exceptional 92.3% |
| Immigrants | Western Europe | 98.5 /100 | #93 | Exceptional 92.3% |
| Immigrants | Europe | 98.5 /100 | #94 | Exceptional 92.3% |
| Immigrants | North Macedonia | 98.5 /100 | #95 | Exceptional 92.3% |
| Icelanders | 98.5 /100 | #96 | Exceptional 92.3% |
| Celtics | 98.4 /100 | #97 | Exceptional 92.3% |
| Immigrants | Kuwait | 98.4 /100 | #98 | Exceptional 92.3% |
| Immigrants | Korea | 98.3 /100 | #99 | Exceptional 92.3% |
| Immigrants | Croatia | 98.3 /100 | #100 | Exceptional 92.3% |
| Swiss | 98.1 /100 | #101 | Exceptional 92.3% |
| Alaskan Athabascans | 98.1 /100 | #102 | Exceptional 92.3% |
| Immigrants | Norway | 98.1 /100 | #103 | Exceptional 92.3% |
| Lebanese | 97.6 /100 | #104 | Exceptional 92.2% |
| Immigrants | Belarus | 97.4 /100 | #105 | Exceptional 92.2% |
| Immigrants | Russia | 97.3 /100 | #106 | Exceptional 92.2% |
| Syrians | 97.2 /100 | #107 | Exceptional 92.2% |
| Jordanians | 97.2 /100 | #108 | Exceptional 92.2% |
| Immigrants | Hungary | 97.0 /100 | #109 | Exceptional 92.1% |
| Palestinians | 97.0 /100 | #110 | Exceptional 92.1% |